SB03: How does a 'Red Warning' Influence the Behaviour of Corona-Warn-App-Users?
- The most important findings in a nutshell: numbers, data, facts
- Active mobile devices and activation of exposure logging
- Surprise at receiving a “red warning”
- The reasons why users were surprised to receive a “red warning” or not
- Relationship between surprise and testing
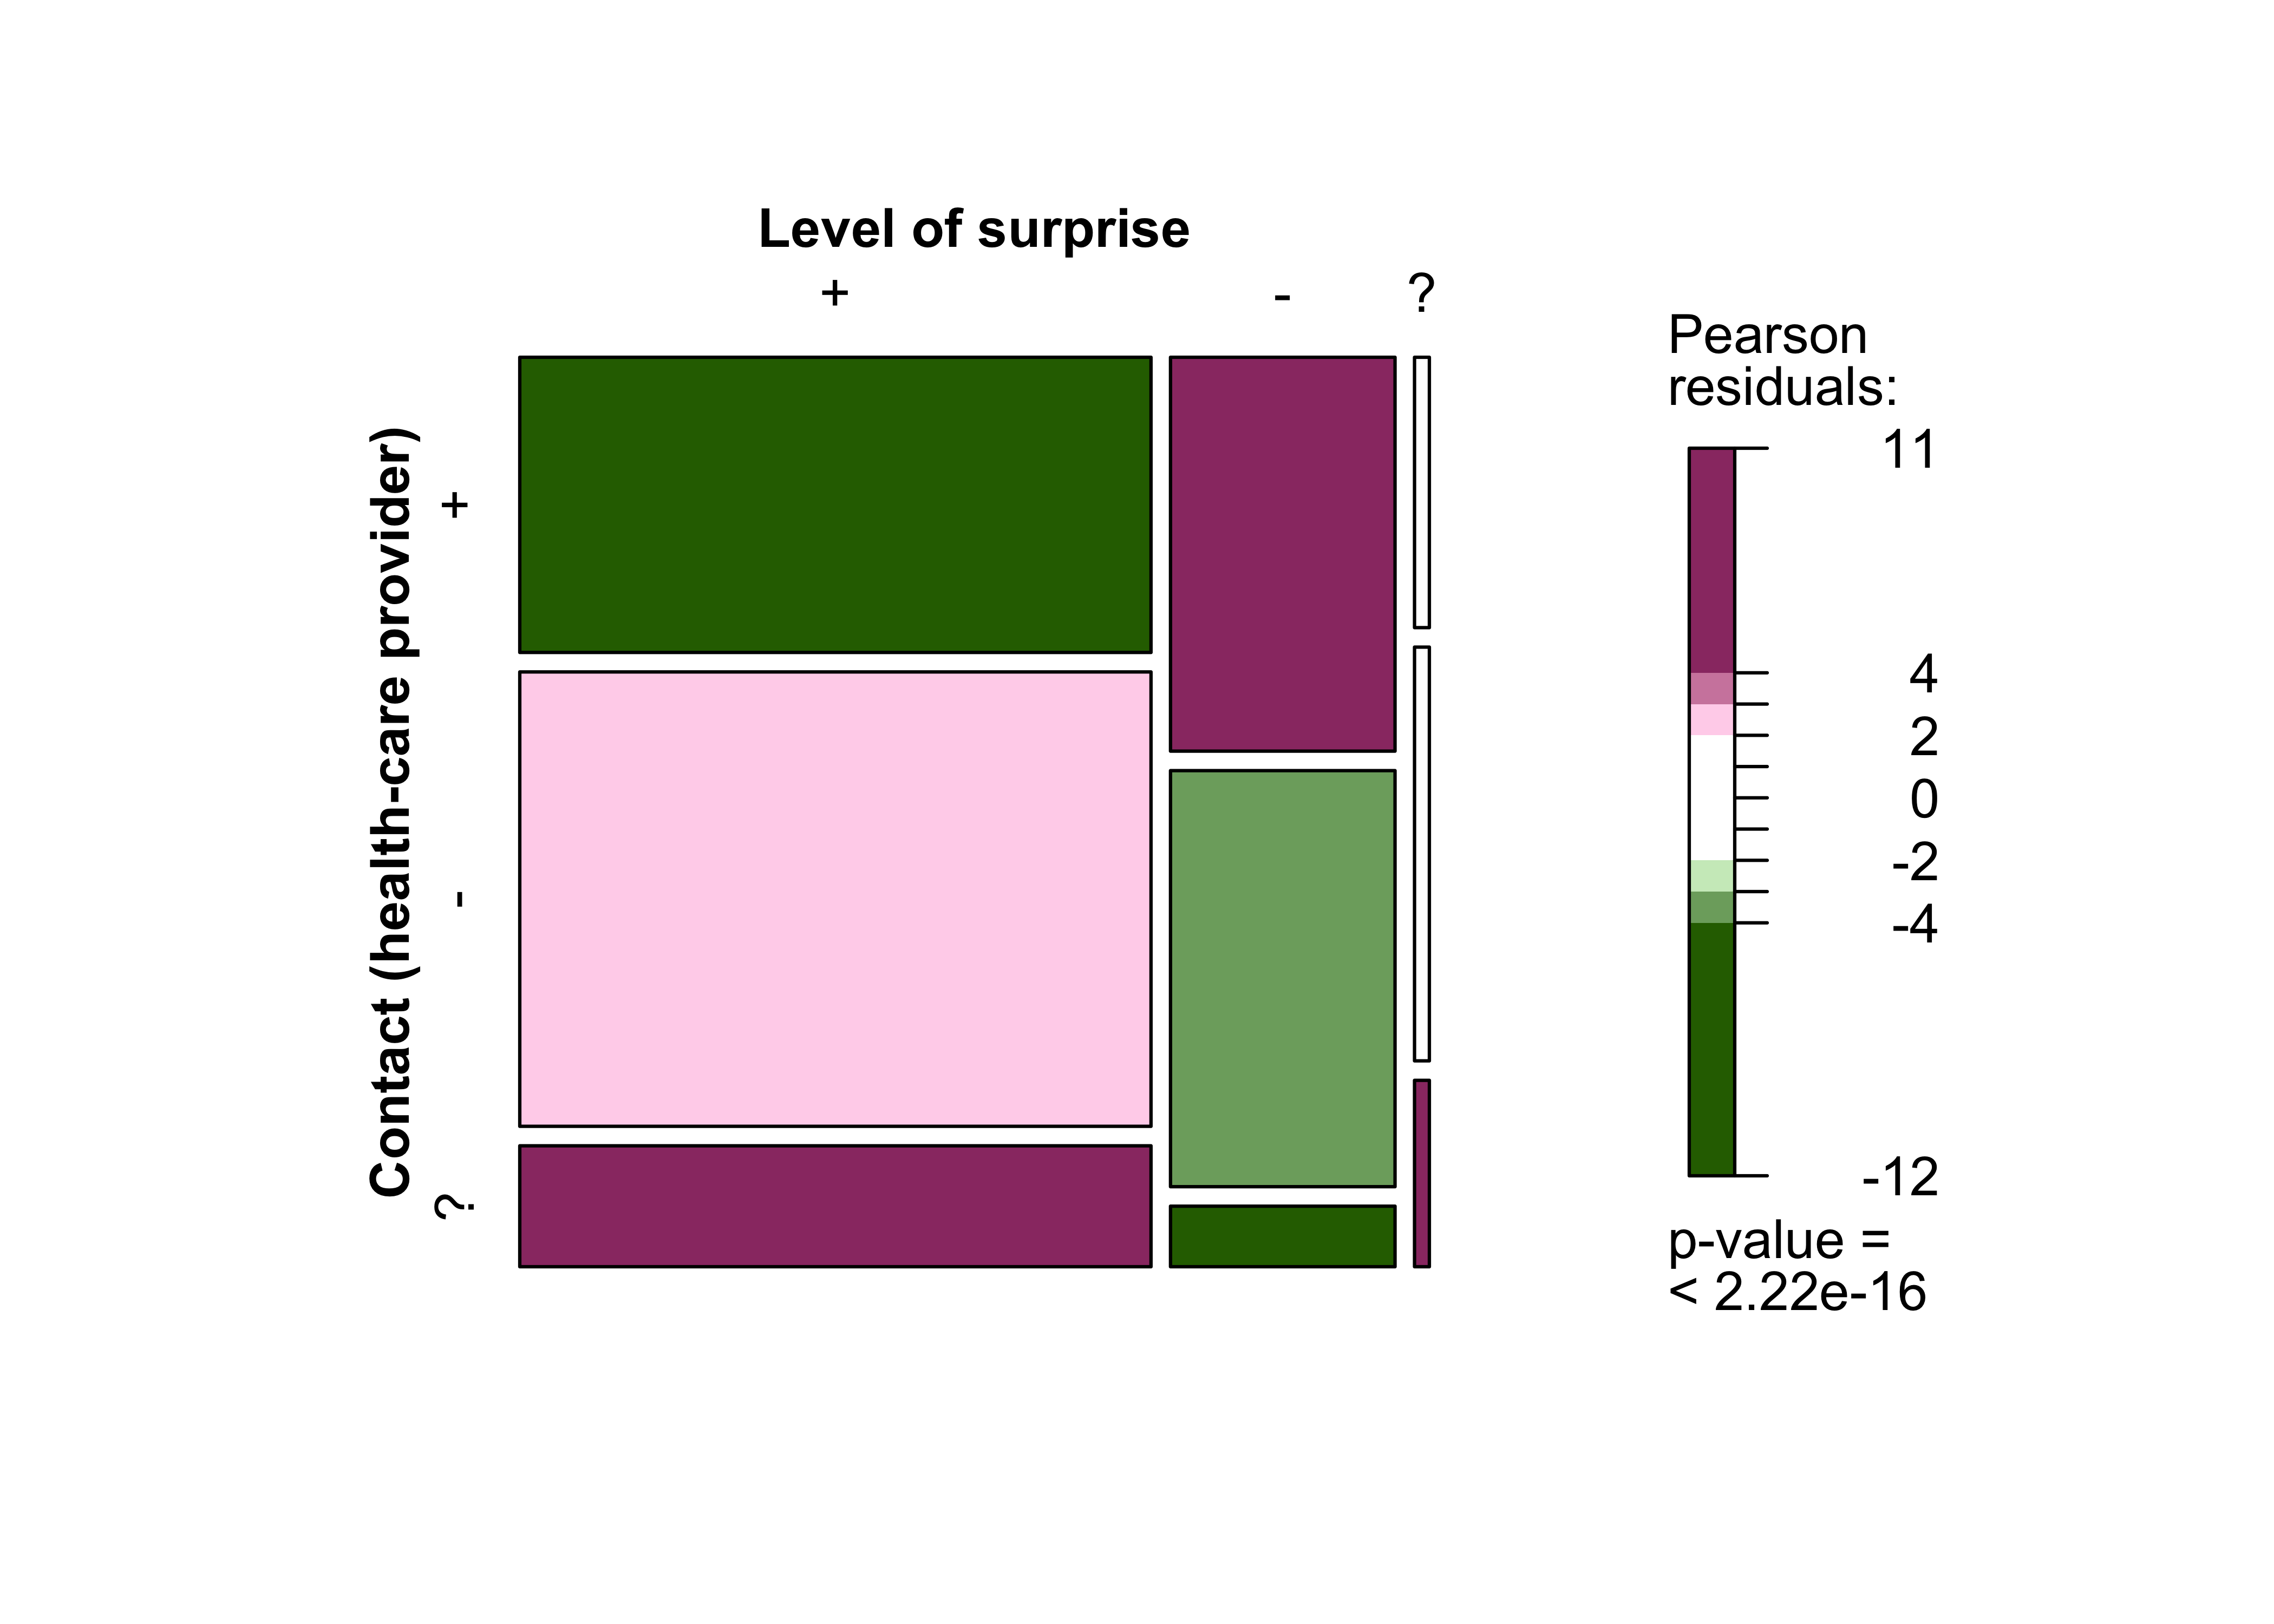
- Relationship between surprise and intended contact with health-care providers
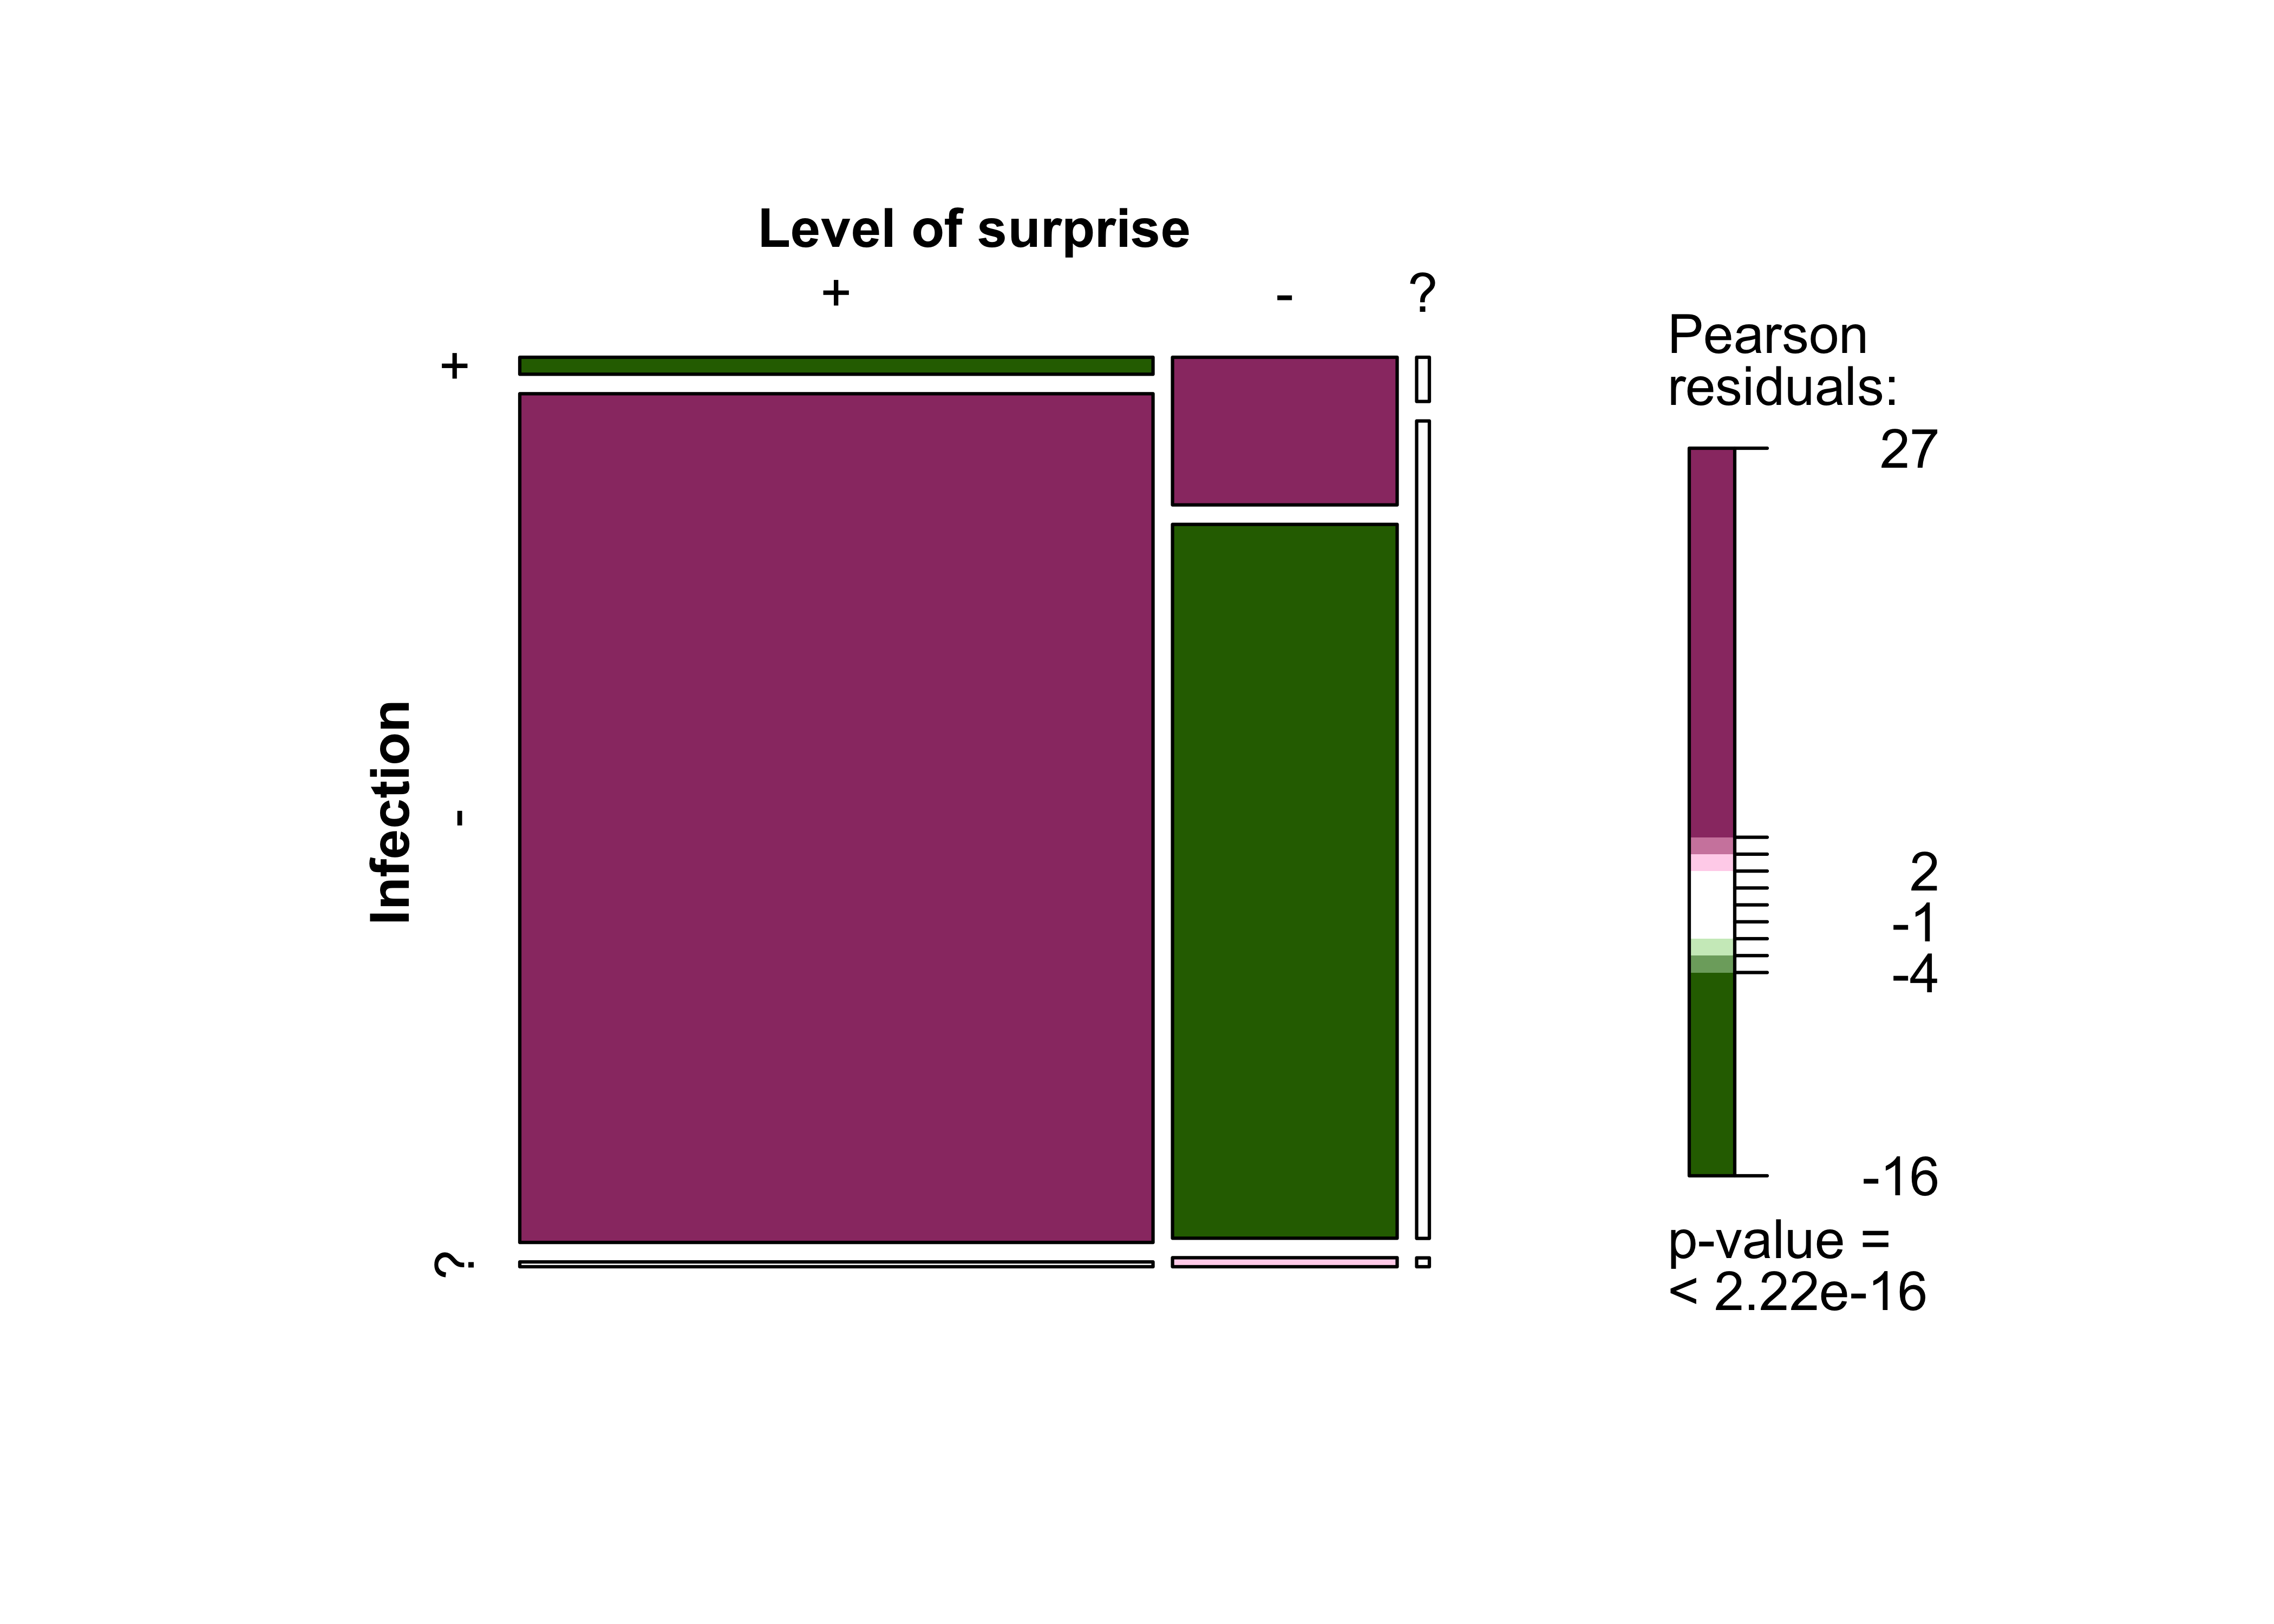
- Relationship between surprise and infection
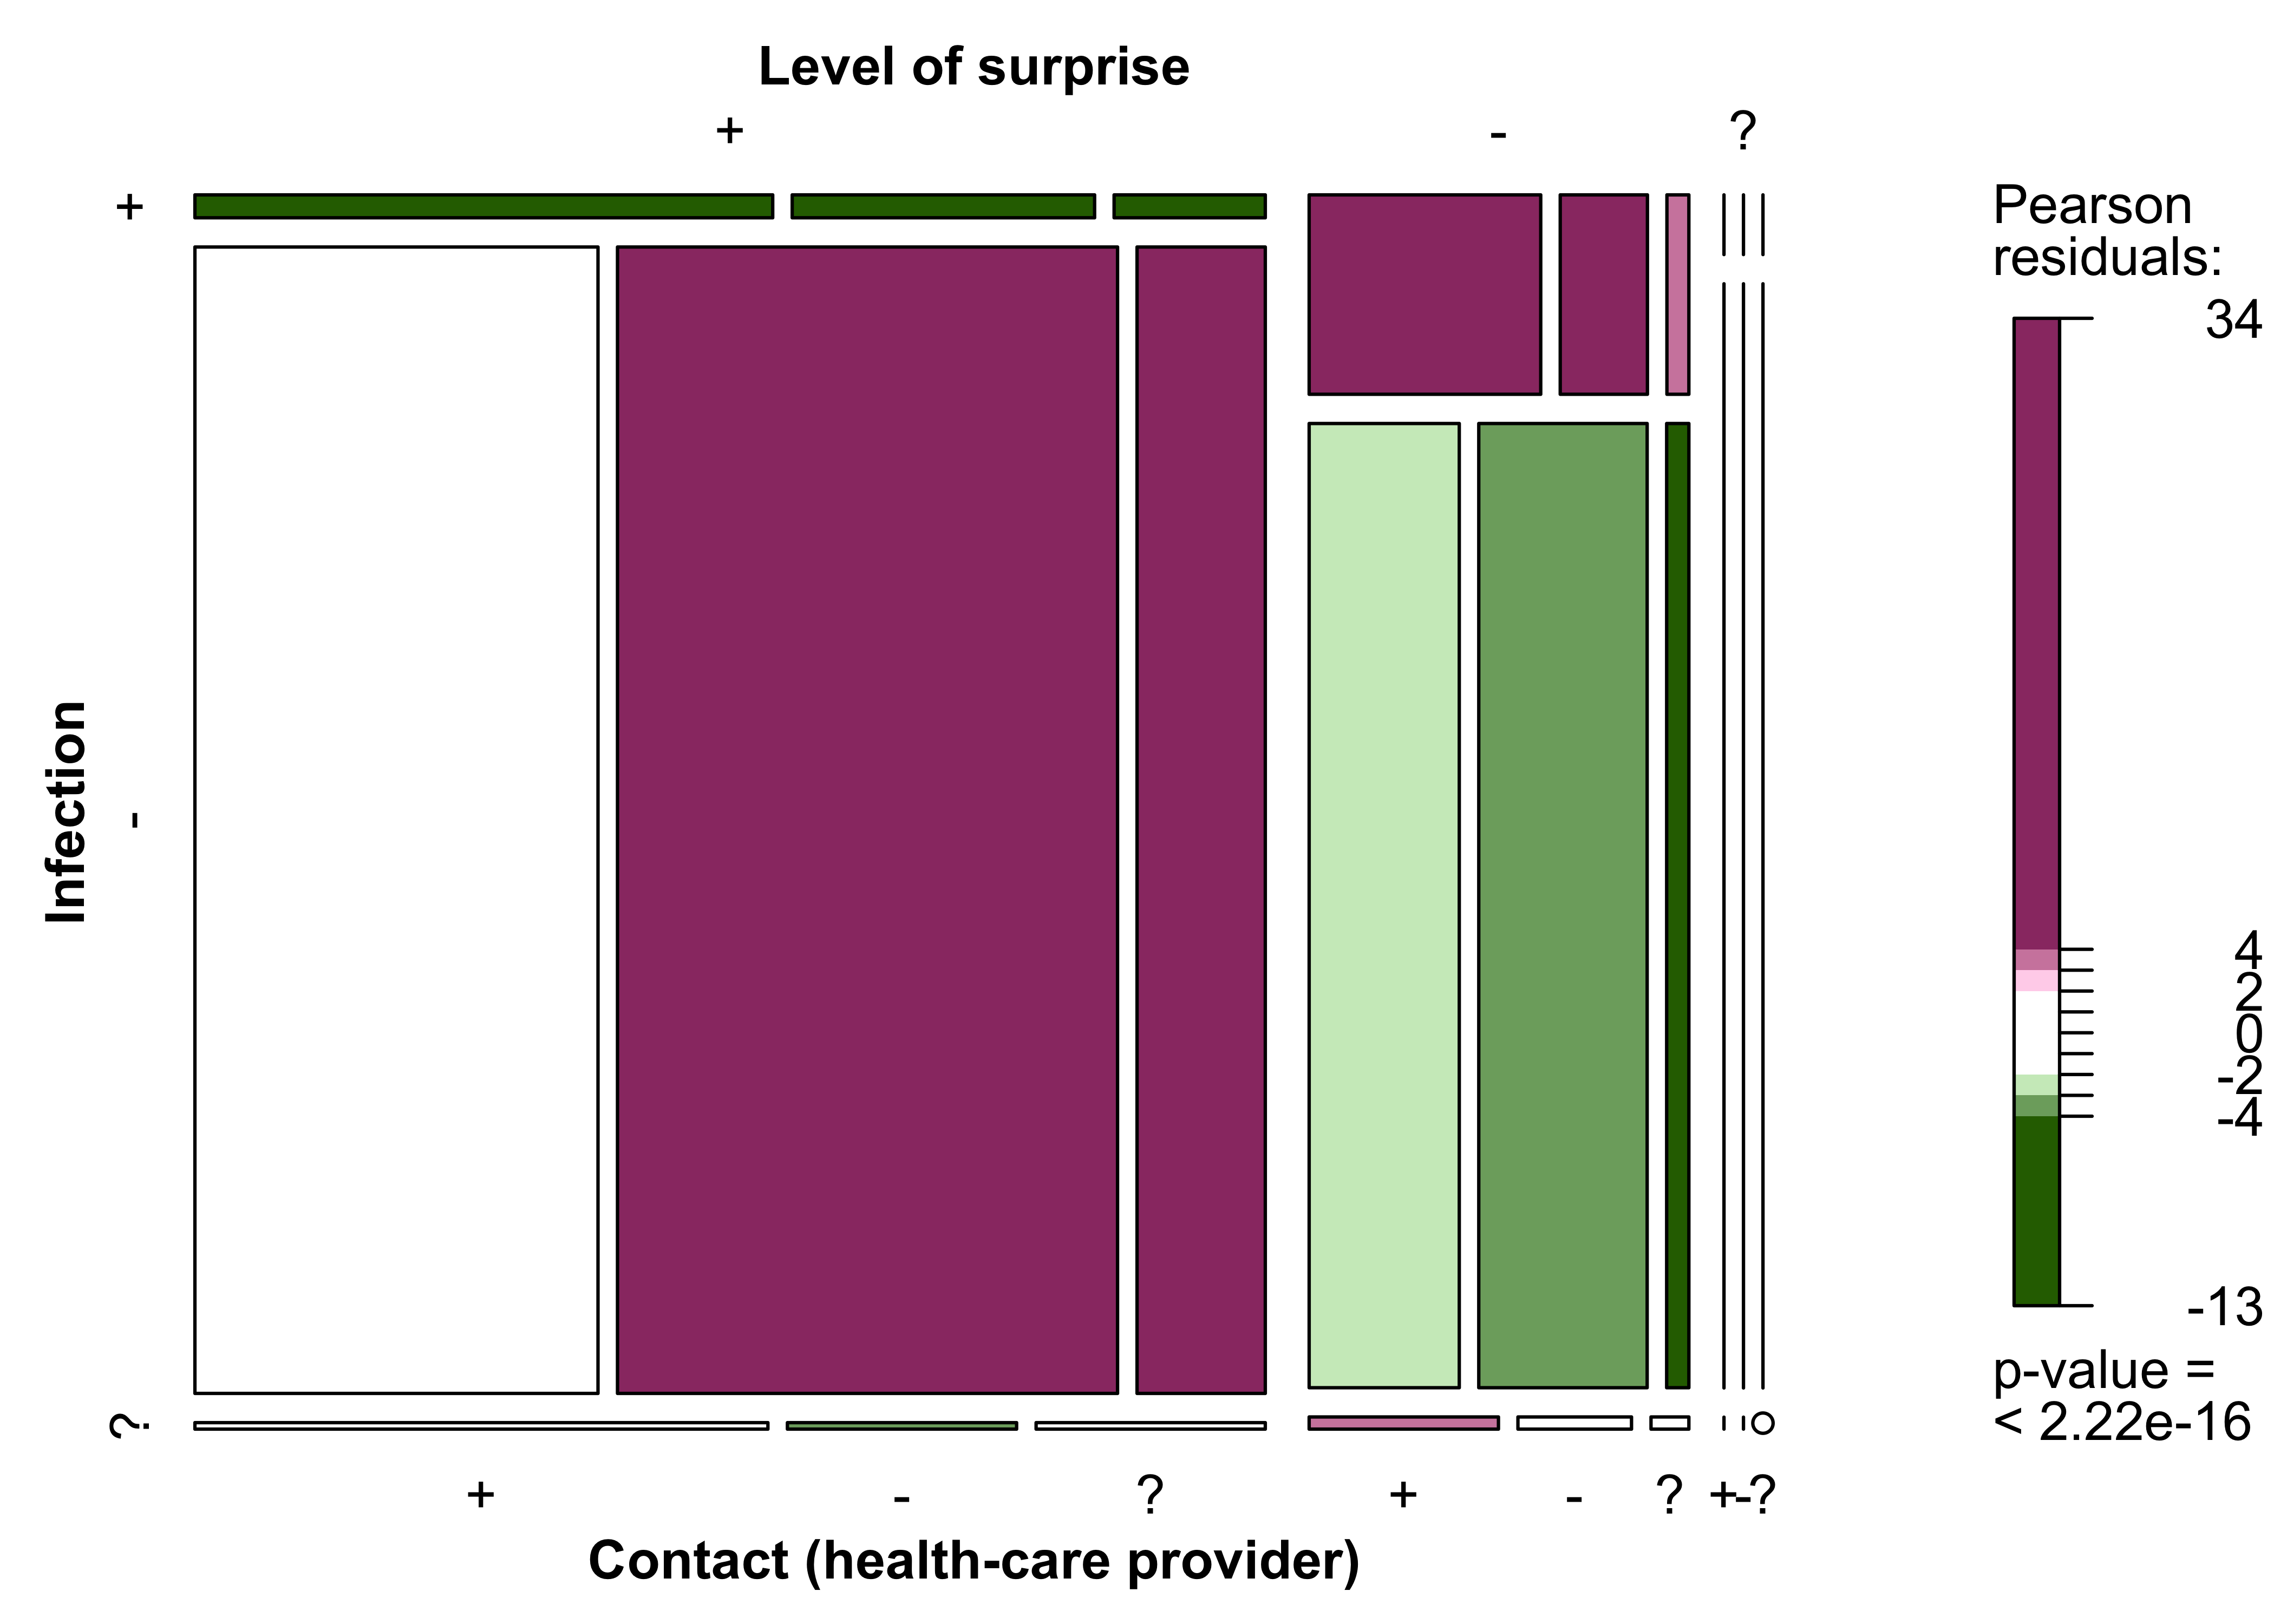
- Relationship between surprise, infection and intention to contact a health-care provider
- Testing
- Symptoms
- What can we learn from the event-driven user survey (EDUS)?
- What to expect in the future?
1. The most important findings in a nutshell: numbers, data, facts
Data from the second part of the event-driven user survey (EDUS) show, among other things, that:
- A significant percentage of the respondents (72.5%) were surprised to receive the
red warning
. - Respondents generally received their test results via the app within 24 hours.
- By communicating their positive results via the app, users enabled warnings to be sent out promptly to people who would have otherwise not been informed about their exposure to infection.
- The majority of users who received a
red warning
adapted their behaviour to help prevent the virus from spreading - The Corona-Warn-App fulfils its purpose of providing early warnings and contributing to ending infection chains.
2. Active mobile devices and activation of exposure logging
2.1 Active mobile devices
Fieldwork for the EDUS took place between March and May 2021. During this time, a basic and a follow-up study were conducted. On 7 April 2021, an additional question was integrated into the basic survey. This question was aimed at collecting data on the number of devices on which respondents had installed the Corona-Warn-App (CWA). The new question was included because it was thought that users could have installed the app on several devices (phones). In addition to privately-owned devices (phones), users may have also installed the app on one or more devices used for work. Understanding how many devices the app has been installed on is key to estimating the number of active users. It was also important to get a sense of how many respondents could – at least in theory – have taken part in the basic survey multiple times because they had received the red warning
on different devices.
The data collected by the EDUS suggest that the CWA is normally installed on one device (at a specific point in time). A small percentage of respondents (just under 9%) reported that they used the app on two devices, whereas an even smaller proportion (less than 2%) stated that they had installed the app on more than two devices. Consequently, the survey results do not substantiate the (albeit anecdotal) evidence of extensive multiple usage. The number of active devices, therefore, is likely to correspond closely to the number of actual users (approx. 12% difference). This does not consider usage on different devices over time.
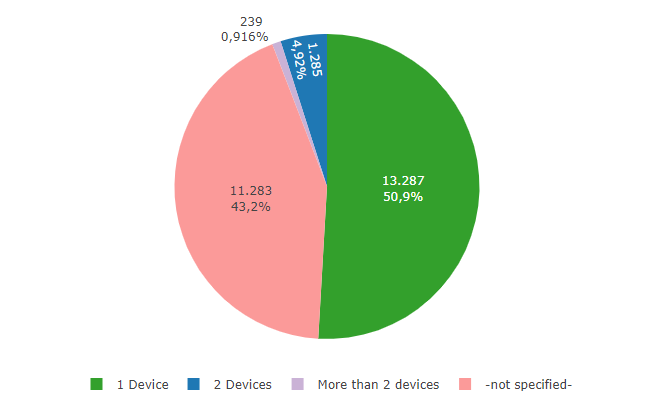
Fig. 1: EDUS - Number of mobile devices on which the Corona-Warn-App is installed.
It should be noted, however, that the data do not rule out the possibility that a small number of people would have been able to take part in the survey several times. The number of active users, therefore, remains inconclusive, and this will be discussed in future articles.
Information on the number of active mobile devices
| On how many mobile devices do you have the Corona-Warn-App installed? | Freq. | Percent | Cum. (valid) |
|---|---|---|---|
| 1 device | 13.287 | 50.9% | 89.7% |
| 2 devices | 1.285 | 4.9% | 8.7% |
| More than 2 devices | 239 | 0.9% | 1.6% |
| - No indication - | 11.283 | 43.2% |
2.2 Activation of exposure logging
A further important issue related to the active use of the CWA is the permanent activation of exposure logging. Although exposure logging is crucial to the app’s core functionality, users are able to switch it on or off as required. When exposure logging is deactivated, the app can no longer detect the close proximity of other users’ phones. If exposure logging has not been activated within the past 14 days, the app will not be able to display any warnings at all. This core functionality of the Corona-Warn-App is always most important when users cannot be informed about the risk of a situation in any other way.
The data demonstrate that the vast majority of respondents used the app as intended and that exposure logging was activated at all times. Only a small number of respondents reported that they never activated exposure logging or did so for less than half of the day.
It has to be taken into consideration here that the question about this issue was not formulated precisely enough and that it may have been misunderstood (for example, that the activation or installation has already taken place more than two weeks ago).
Data provided on activation of exposure logging
| Did you activate the exposure logging within the last 14 days? | Number | Percentage | Percentage (valid) |
|---|---|---|---|
| Yes, continuously | 22.925 | 87.9% | 91.9% |
| Yes, more than half of the time | 1.047 | 4.0% | 4.2% |
| Yes, less than half of the time | 456 | 1.7% | 1.8% |
| No | 284 | 1.1% | 1.1% |
| Don’t know | 246 | 0.9% | 1.0% |
| - not specified - | 1.136 | 4.4% |
3 Surprise at receiving a red warning
The CWA helps to end chains of infection that would otherwise have gone undetected at an early stage.
The basic survey asked whether the respondents were surprised to receive the red warning
. Almost three quarters of the participants (72.5%) stated that they were.
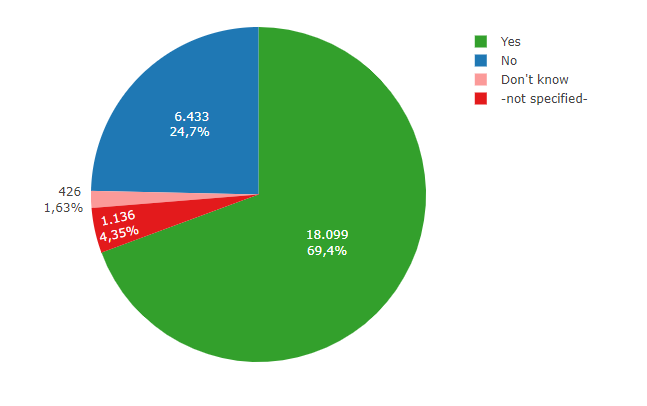
Fig. 2: EDUS – Level of surprise at receiving a red warning
Data provided on level of surprise
Were you surprised by the display of the red warning? |
Number | Percentage | Percentage (valid) |
|---|---|---|---|
| Yes | 18.099 | 69.4% | 72.5% |
| No | 6.433 | 24.7% | 25.8% |
| Don't know | 426 | 1.6% | 1.7% |
| -not specified- | 1.136 | 4.4% |
3.1 The reasons why users were surprised to receive a red warning
or not
The majority of the 25.8% of users who were not surprised to receive a red warning
had already been informed about an infection by people they knew. News about infections can spread faster among family and friends than among people who know each other only in passing or at least not personally. Moreover, it is likely that people would find it easier to talk to close relatives about a COVID-19 infection than to people they know less well. If this is the case, people are more likely to be informed by family members when they have been exposed to COVID-19. This may be due to the fact that people tend to regard their health as a private matter, and because they can probably expect a less negative response from people they know directly. At the same time, it is normally easier and faster for people to get in touch with people they know than strangers.
Respondents were asked why they were surprised to receive the warning. The questionnaire offered several response categories. The study found that a large percentage of the not-surprised respondents already knew that a family member had tested positive (40.2%). They mentioned work connections (27.1%) and friends (14.6%) somewhat less frequently. During the design of the study, it was assumed that childcare would play a greater role in this context. However, this hypothesis is not confirmed by the data. In order to collect as much information as possible while still adhering to the data-minimisation principle, the questionnaire also provided the response category for other reasons
, which was selected by 20.3% of those surveyed. Unfortunately, it is unclear which other reasons
the respondents had in mind when answering the question.
Data provided on reasons for non-surprise
| Why were you not surprised by the indication of an increased risk? | Number | Percentage |
|---|---|---|
| Because people in my peer group recently tested positive | 936 | 14.6% |
| Because people in my family have recently tested positive | 2.583 | 40.2% |
| Because people at work recently tested positive | 1.741 | 27.1% |
| Because people in my children's care environment recently tested positive | 95 | 1.5% |
| For other reasons | 1.307 | 20.3% |
| Don’t know | 93 | 1.4% |
| Variable | Level of surprise | Total | ||
|---|---|---|---|---|
| Yes | No | Don’t know | ||
| Estimated risk | ||||
| High | 476 (1.9%) | 817 (3.3%) | 15 (<0.1%) | 1.308 (5.2%) |
| Rather high | 788 (3.2%) | 739 (3.0%) | 34 (0.1%) | 1.561 (6.3%) |
| Neutral | 2.616 (10%) | 1.246 (5.0%) | 89 (0.4%) | 3.951 (16%) |
| Rather low | 5.451 (22%) | 1.642 (6.6%) | 128 (0.5%) | 7.221 (29%) |
| Low | 8.441 (34%) | 1.874 (7.5%) | 144 (0.6%) | 10.459 (42%) |
| Don’t know | 294 (1.2%) | 106 (0.4%) | 15 (<0.1%) | 415 (1.7%) |
| - not specified - | 3 (<0.1%) | 3 (<0.1%) | 0 (0%) | 6 (<0.1%) |
| Total | 18.069 (73%) | 6.427 (26%) | 425 (1.7%) | 24.921 (100%) |
Data provided on estimated risk
| How high did you estimate your risk of being infected before reporting through the app? | Number | Percentage | Percentage (valid) |
|---|---|---|---|
| High | 1.310 | 5.0% | 5.3% |
| Rather high | 1.562 | 6.0% | 6.3% |
| Neutral | 3.956 | 15.2% | 15.9% |
| Rather low | 7.226 | 27.7% | 29.0% |
| Low | 10.472 | 40.1% | 42.0% |
| Don’t know | 415 | 1.6% | 1.7% |
| - not specified - | 1.153 | 4.4% |
3.2 Relationship between surprise and testing
Participants who were surprised to receive a red warning
either undertook rapid antigen tests more often or did not take any test at all slightly more often than respondents who were not surprised to have received the warning. There are many possible explanations for this.
| Variable | Level of surprise | Total | ||
|---|---|---|---|---|
| Yes | No | Don’t know | ||
| Test | ||||
| Yes, a PCR test | 2.660 (11%) | 1.399 (5.6%) | 55 (0.2%) | 4.114 (17%) |
| Yes, a rapid antigen test | 5.537 (22%) | 1.219 (4.9%) | 108 (0.4%) | 6.864 (28%) |
| Yes, a PCR test and a rapid antigen test | 1.402 (5.6%) | 828 (3.3%) | 31 (0.1%) | 2.261 (9.1%) |
| Yes, but I don’t know what kind of test | 225 (0.9%) | 38 (0.2%) | 3 (<0.1%) | 266 (1.1%) |
| No | 1.571 (6.3%) | 426 (1.7%) | 26 (0.1%) | 2.023 (8.1%) |
| - not specified - | 6.674 (27%) | 2.517 (10%) | 202 (0.8%) | 9.393 (38%) |
| Total | 18.069 (73%) | 6.427 (26%) | 425 (1.7%) | 24.921 (100%) |
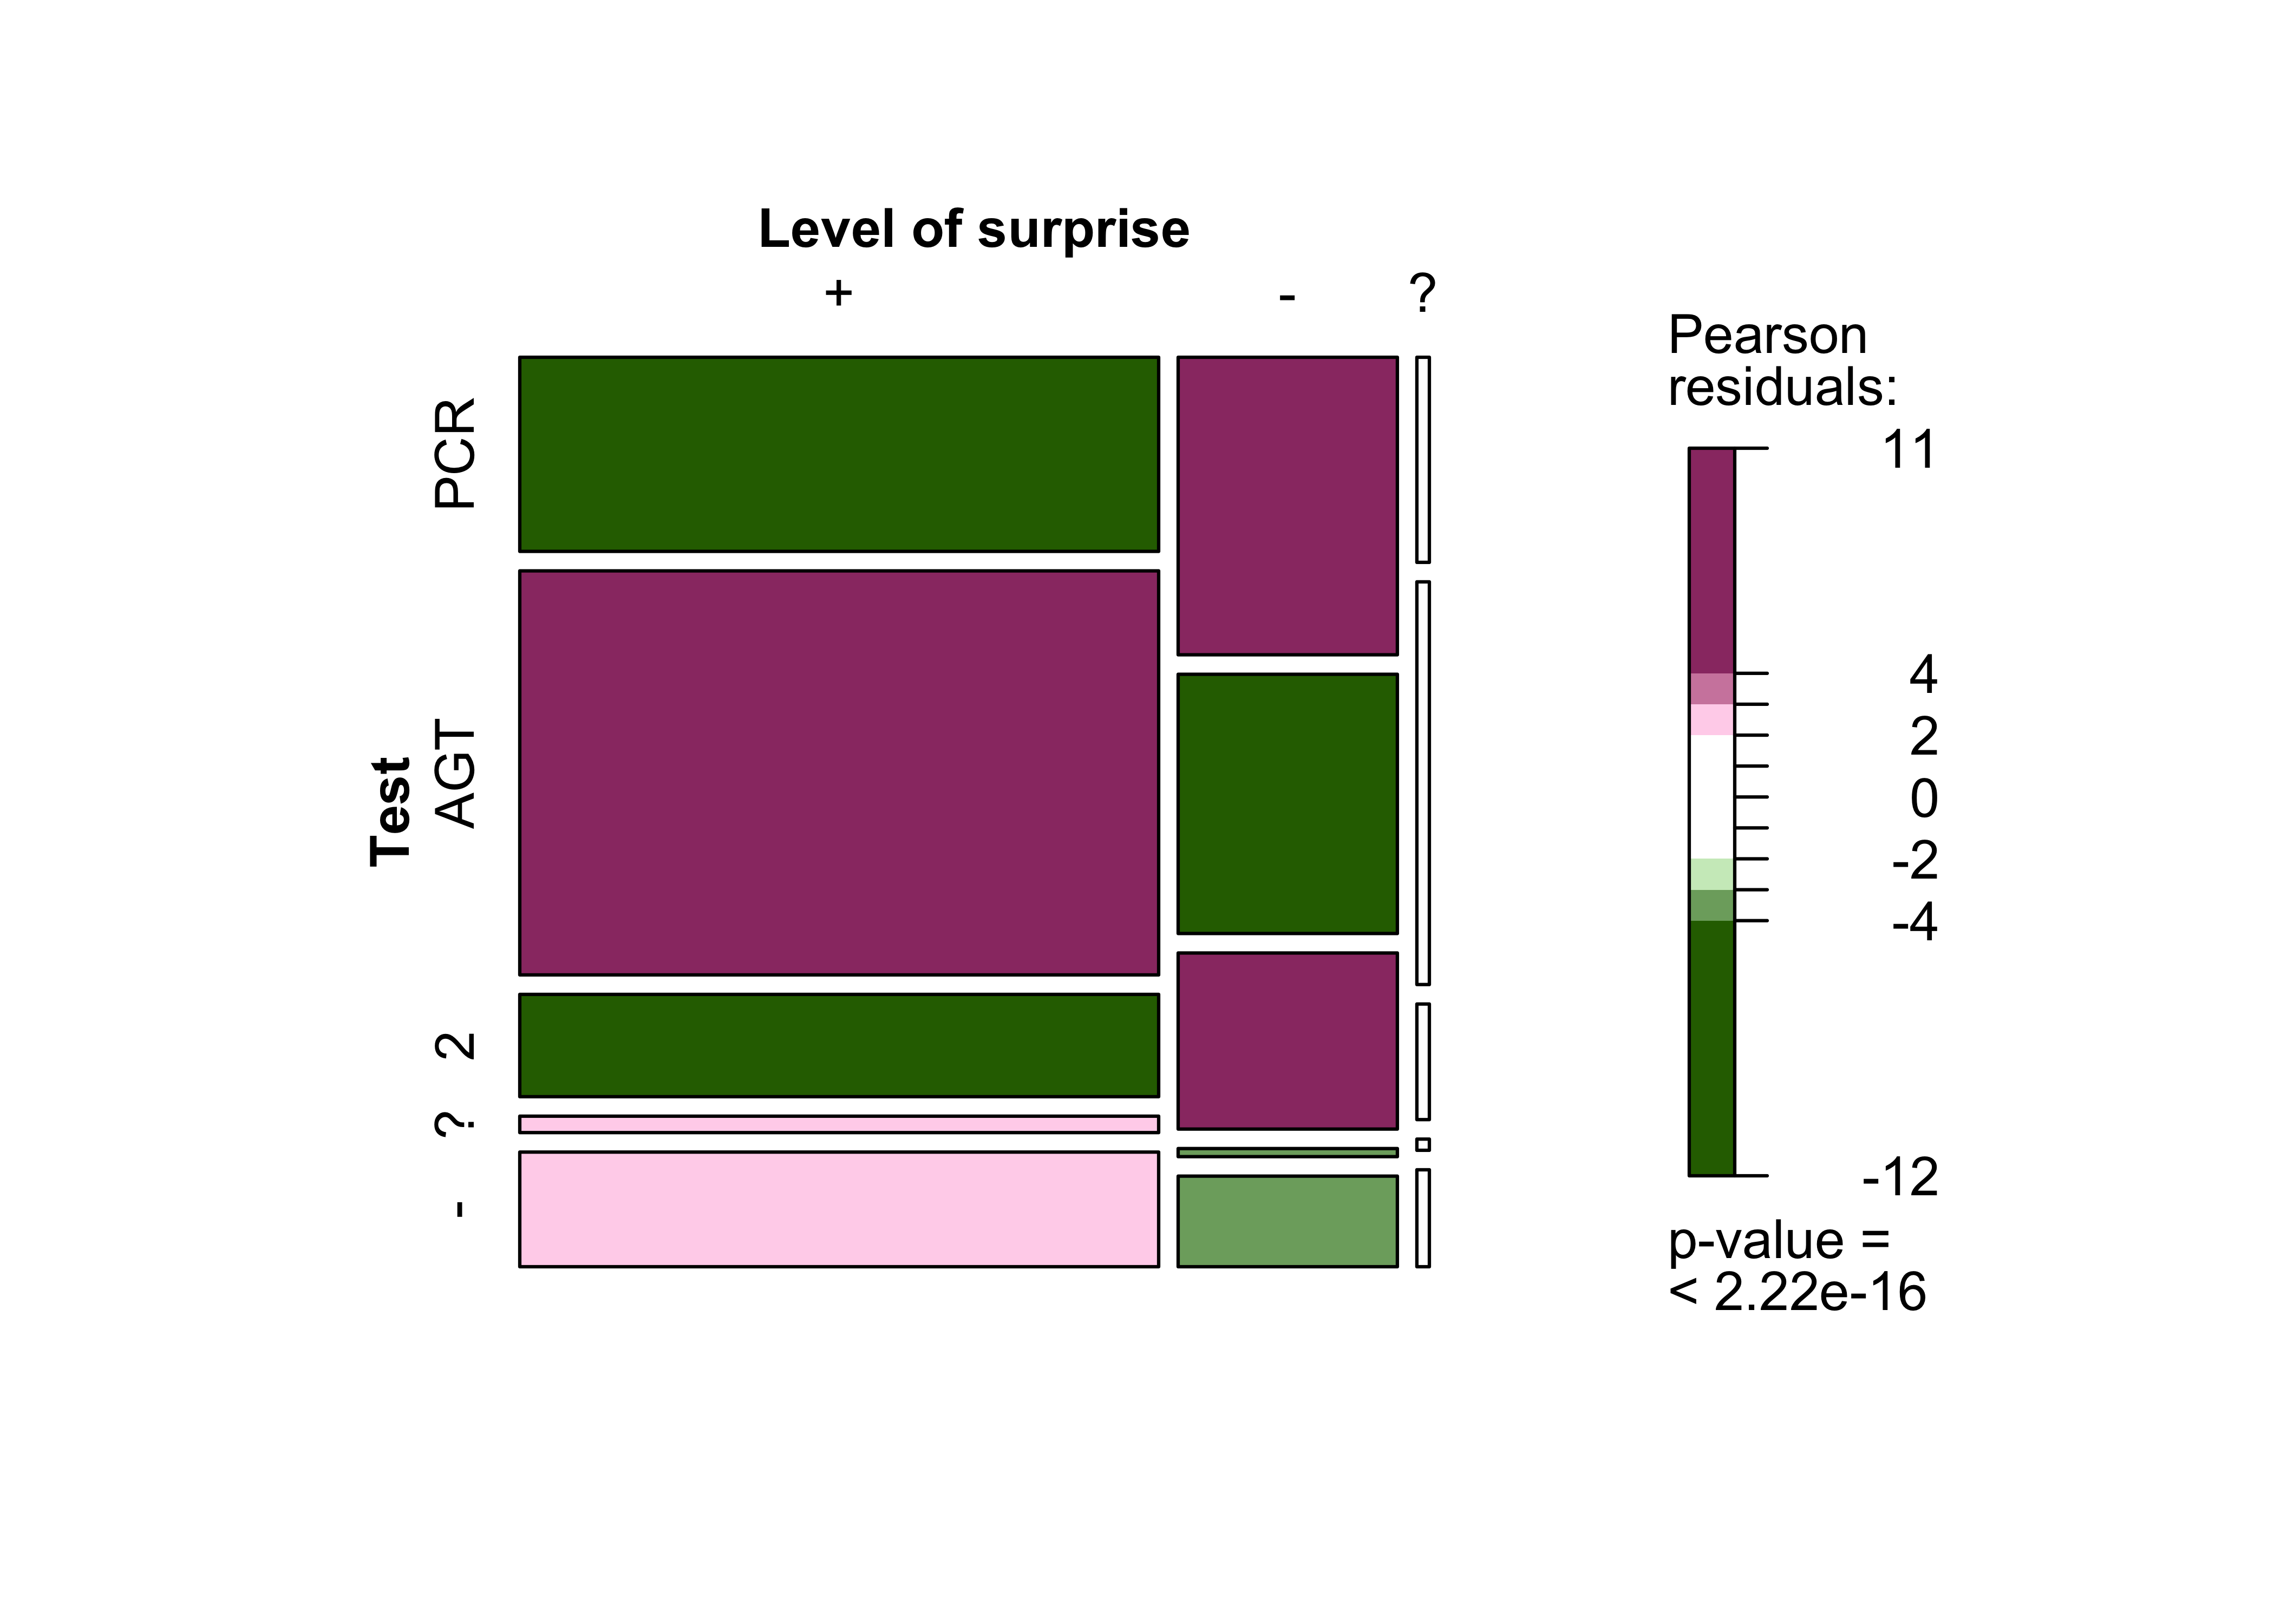
3.3 Relationship between surprise and intended contact with health-care providers
Respondents who were surprised to receive a red warning
were less likely to contact a health-care provider than respondents who were not surprised to receive the warning. The exact reasons for this remain unclear. However, the period during which the survey was conducted could have played a role. Both questions are taken from the basic survey. During the study period, the respondents faced numerous uncertainties. Moreover, it is possible that someone who received a red warning
via the app out of nowhere would react differently to someone who had already noticed warning signs among people they know about their potential exposure to infection and already had time to adjust to the situation.
Most respondents who intended to contact a health-care provider planned to contact their GP (55.2%). Once again, respondents were provided with a number of possible response categories when answering this question. Contact to their local health authority (43.4%) was selected less frequently. The telephone number of the on-call medical service and hospitals played a subordinate role in the survey. The data show that users treated the warning seriously and assumed that they were at risk from infection. Moreover, this generally led them to contact a health-care provider – particularly their GP. The contact with GPs argues strongly for the intended relief of the public health service by the Corona-Warn-App. Any associated cases of COVID-19 would only be confirmed once the user goes on to take a test. Testing suspected cases of COVID-19 helps to end chains of infection. The CWA, therefore, acts as an early warning system, and its value is particularly evident in cases where users have come into contact with infected people that they do not know. The app helps inform users about the need for testing and, therefore, contributes to improving the efficiency of testing strategies.
| Variable | Level of surprise | Total | ||
|---|---|---|---|---|
| Yes | No | Don’t know | ||
| Making contact (healthcare) | ||||
| Yes | 6.127 (25%) | 2.908 (12%) | 132 (0.5%) | 9.167 (37%) |
| No | 9.432 (38%) | 3.072 (12%) | 202 (0.8%) | 12.706 (51%) |
| Don’t know | 2.510 (10%) | 447 (1.8%) | 91 (0.4%) | 3.048 (12%) |
| Total | 18.069 (73%) | 6.427 (26%) | 425 (1.7%) | 24.921 (100%) |
Data provided on intention to contact a health-care provider
| Are you going to contact the health service now? | Number | Percentage | Percentage (valid) |
|---|---|---|---|
| Yes | 9.168 | 35.1% | 36.8% |
| No | 12.708 | 48.7% | 51.0% |
| Don’t know | 3.048 | 11.7% | 12.2% |
| - not specified - | 1.170 | 4.5% |
| Who will you contact? | Number | Percentage |
|---|---|---|
| I will contact my family doctor | 5.058 | 55.2% |
| I will contact the responsible health department | 3.978 | 43.4% |
| I will call the central number 116 117 | 2.284 | 24.9% |
| I'm going to a hospital | 194 | 2.1% |
| Don’t know | 502 | 5.5% |
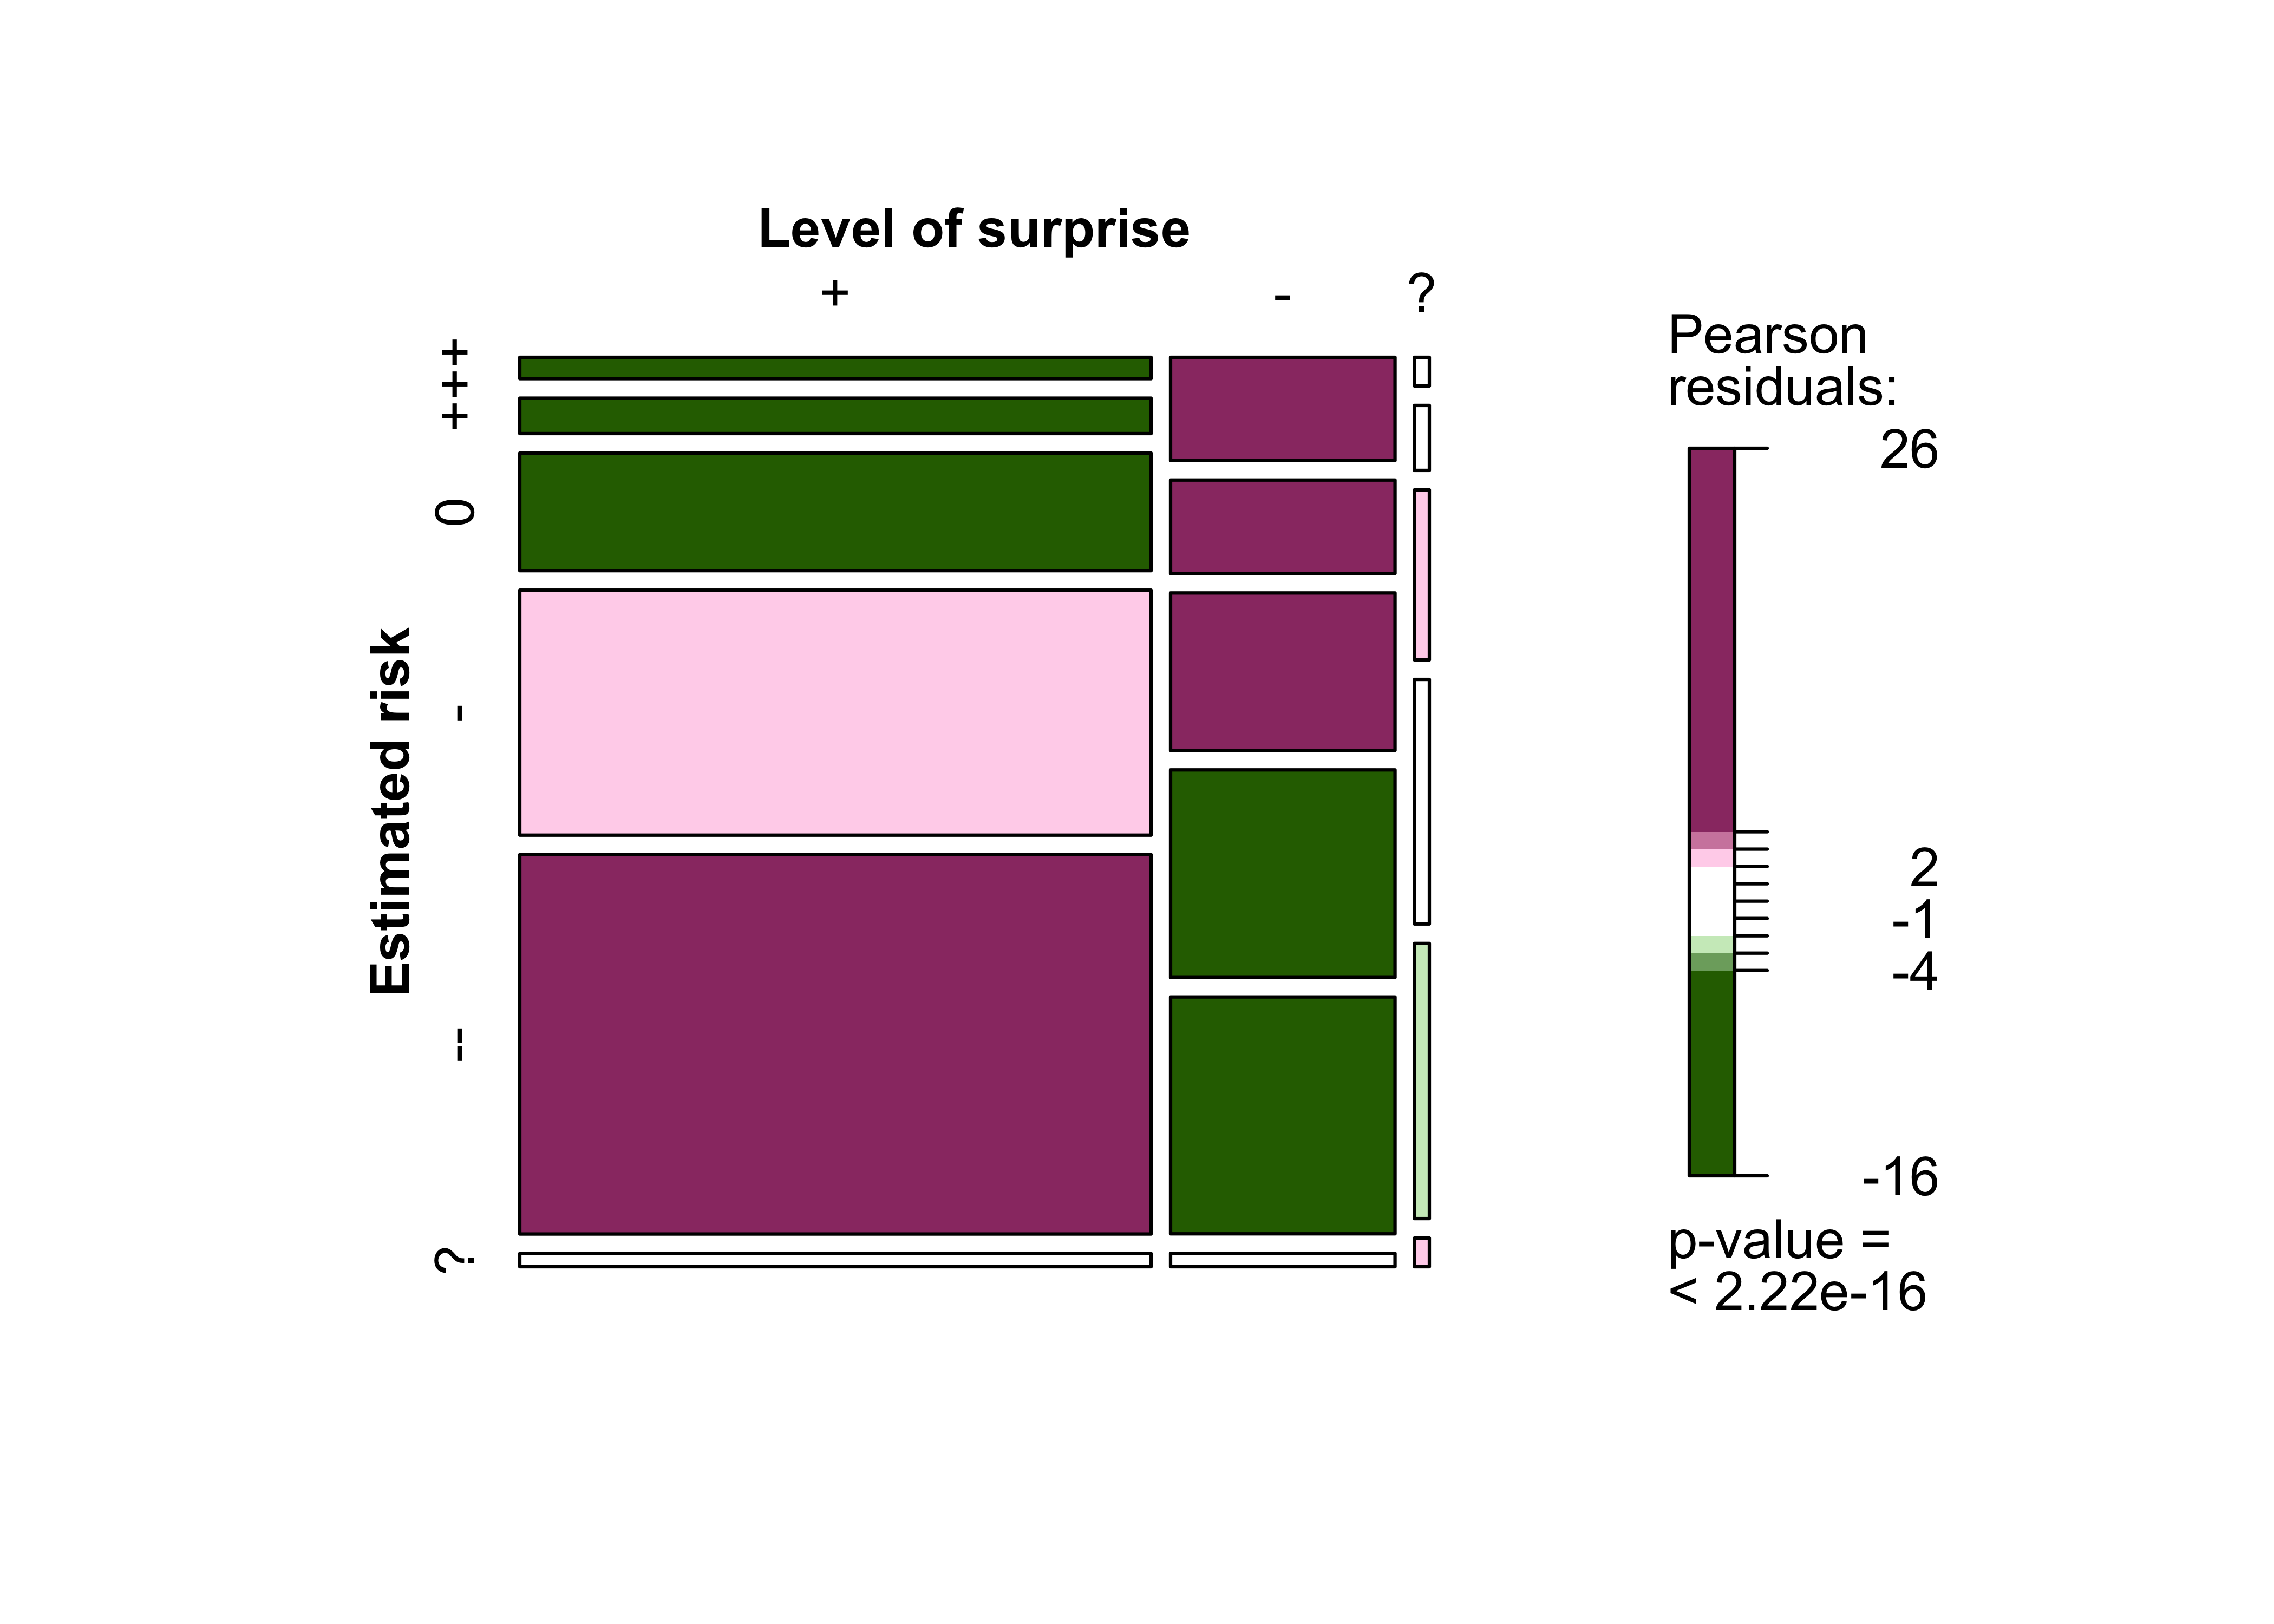
3.4 Relationship between surprise and infection
Respondents who were surprised to receive a red warning
tested positive for SARS-CoV-2 less often than users who were not surprised. As stated above, respondents who were unsurprised had usually already been informed about an infection by someone from their immediate social environment.
It is not always possible to maintain social distancing and fully comply with hygiene rules when among family, friends or at work. However, it is easier to do so when among casual acquaintances and strangers, such as on public transport and while shopping. If contact with people from a user’s immediate environment is more likely to lead to an infection, this could explain the divergences between test results among different groups of people.
| Variable | Level of surprise | Total | ||
|---|---|---|---|---|
| Yes | No | Don’t know | ||
| Infection | ||||
| Positive for SARS-CoV-2 | 191 (0.8%) | 590 (2.4%) | 10 (<0.1%) | 791 (3.2%) |
| Negative for SARS-CoV-2 | 9.562 (38%) | 2.853 (11%) | 185 (0.7%) | 12.600 (51%) |
| Inconclusive | 54 (0.2%) | 36 (0.1%) | 2 (<0.1%) | 92 (0.4%) |
| - not specified - | 8.262 (33%) | 2.948 (12%) | 228 (0.9%) | 11.438 (46%) |
| Total | 18.069 (73%) | 6.427 (26%) | 425 (1.7%) | 24.921 (100%) |
3.5 Relationship between surprise, infection and intention to contact a health-care provider
The relationship between level of surprise, infection and intention to contact a health-care provider is summarised in the following graph.
4 Testing
Both the basic and the follow-up survey treated testing for SARS-CoV-2 as a key issue. The basic survey focused on users’ testing intentions with the follow-up survey addressing the actual tests that were carried out.
4.1 Testing intention
Over two thirds of respondents (in the basic survey) stated that they intended to take a test immediately after having received a red warning
(68.2%). Another 16.6% intended to delay the decision until they had sought medical advice/consulted a health-care provider. A small fraction of respondents (4.2%) were undecided and 11.1% stated that they did not intend to take a test.
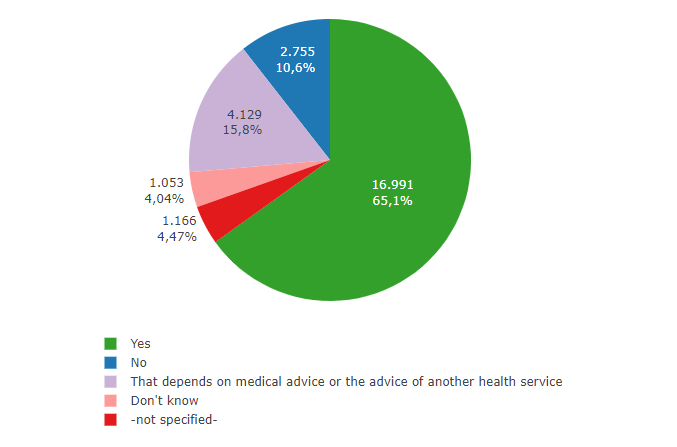
Fig. 8: EDUS – Testing intention
Respondents (from the basic survey) who stated they would be taking a test were then asked which test they intended to take. The largest group of respondents planned to take a rapid antigen test (44.6%), 29.5% wanted to take the more precise PCR test and 18.1% intended to take both an antigen and a PCR test. A further 6.7% wanted to seek medical advice first; 1.2% did not know.
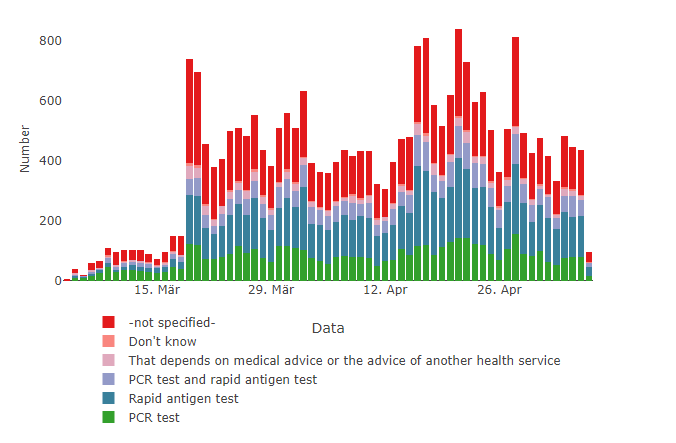
Fig. 9: EDUS – Testing intention by test type (developments over time)
Details of testing intentions
| Are you going to take a SARS-CoV-2 test? | Number | Percentage | Percentage (valid) |
|---|---|---|---|
| Yes | 16.991 | 65.1% | 68.2% |
| No | 2.755 | 10.6% | 11.1% |
| That depends on medical advice or the advice of another health service | 4.129 | 15.8% | 16.6% |
| Don’t know | 1.053 | 4.0% | 4.2% |
| - not specified - | 1.166 | 4.5% |
| Which test are you likely to take? | Number | Percentage | Percentage (valid) |
|---|---|---|---|
| PCR test | 5.004 | 19.2% | 29.5% |
| Rapid antigen test | 7.573 | 29.0% | 44.6% |
| PCR test and Rapid antigen test | 3.069 | 11.8% | 18.1% |
| That depends on medical advice or the advice of another health service | 1.144 | 4.4% | 6.7% |
| Don’t know | 201 | 0.8% | 1.2% |
| - not specified - | 9.103 | 34.9% |
4.2 Test Results
Data from the follow-up survey can be used to examine the relationship between the test that users intended to take and which test, if any, they actually took. 87% of the participants in the follow-up survey were tested for SARS-CoV-2 as a direct result of receiving a red warning
. A comparison of the data demonstrates how closely the respondents implemented their intended testing strategy. The largest group of participants were those who had intended to conduct a rapid antigen test (44.6%). Rapid antigen tests were also the most frequently mentioned type of test in the follow-up survey (44.2%). Over a quarter of respondents opted for a PCR test only (26.5%), whereas 14.6% combined a rapid antigen with a PCR test. Greater uptake of PCR testing would have been preferable, as these are more reliable, detect infection at an earlier stage, and are regularly used to confirm suspected cases of COVID-19.
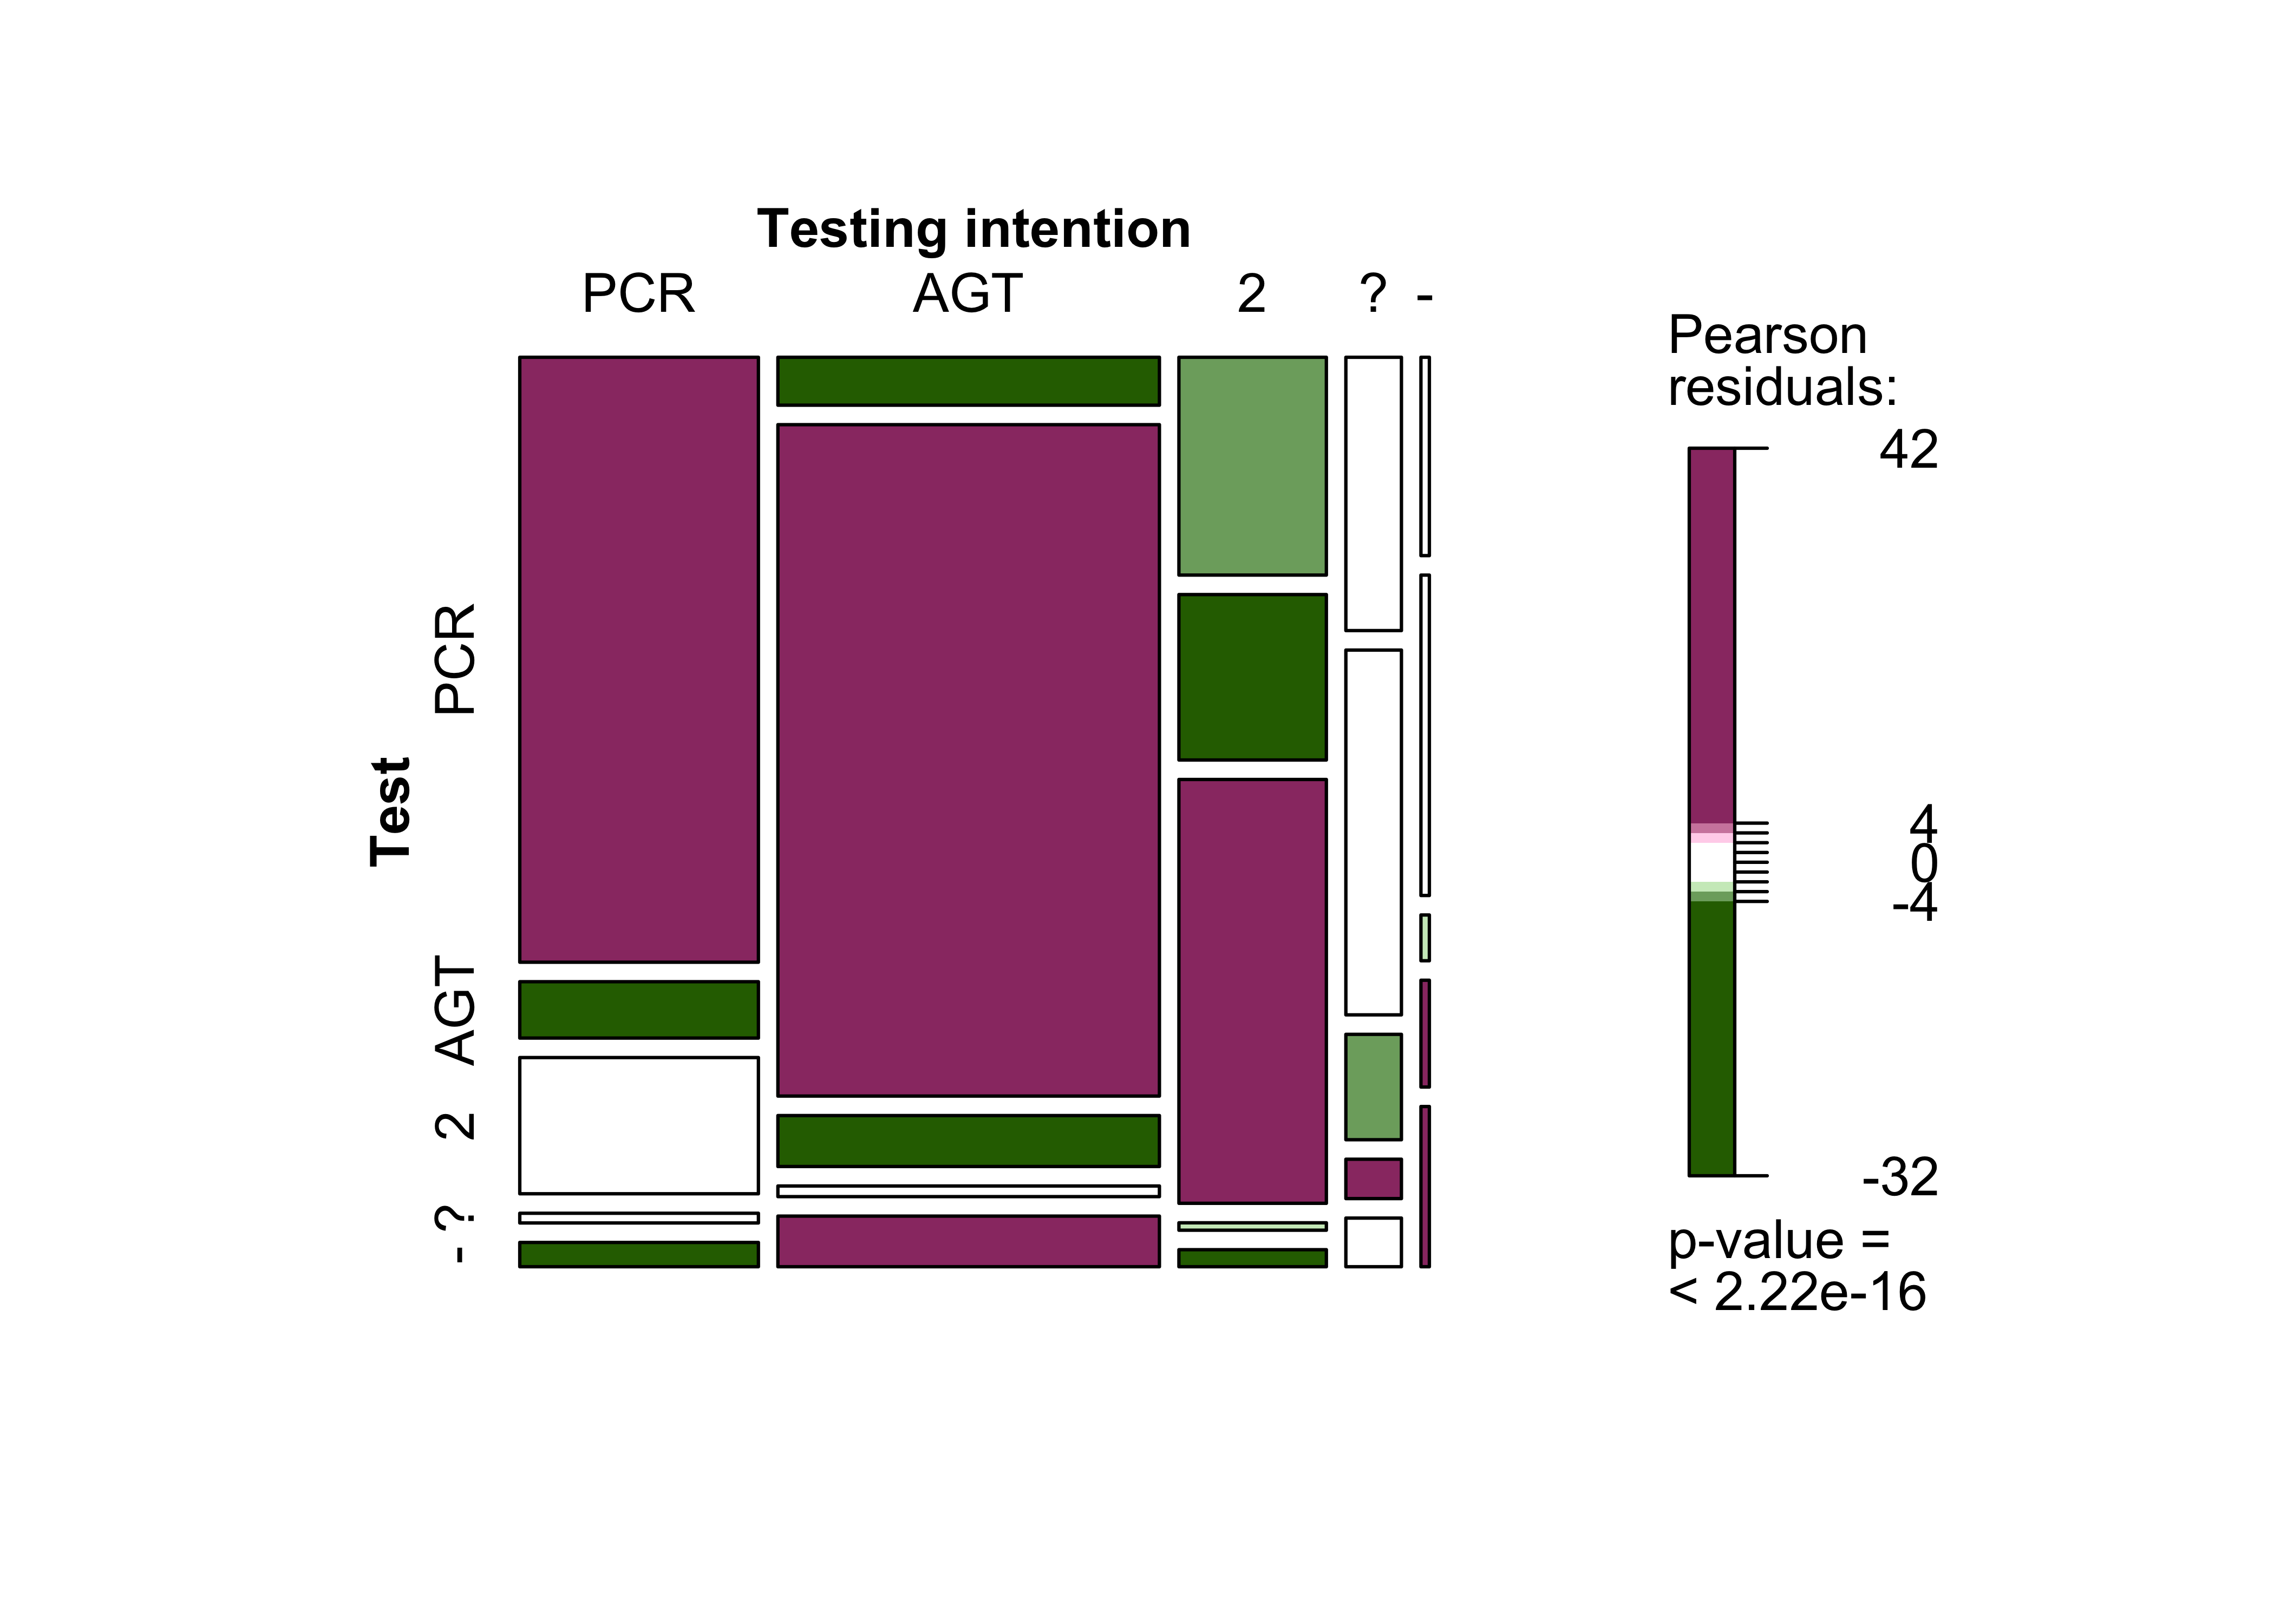
The data demonstrate that the respondents generally implemented their stated testing strategy. 73% of respondents who had intended to have a PCR test, and 80.8% of respondents who planned to take a rapid antigen test, actually did so. However, there is greater variance with regard to multiple tests and intention to seek medical advice.
| Variable | Test (carried out) | Total | ||||
|---|---|---|---|---|---|---|
| Yes, a PCR test | Yes, a rapid antigen test | Yes, a PCR test and a rapid antigen test | Yes, but I don’t know, what kind of test | No | ||
| Testing intention | ||||||
| PCR test | 2.243 (73%) | 209 (6.8%) | 505 (16%) | 36 (1.2%) | 90 (2.9%) | 3.083 (100%) |
| Rapid antigen test | 284 (5.8%) | 3.980 (81%) | 302 (6.1%) | 63 (1.3%) | 300 (6.1%) | 4.929 (100%) |
| PCR test and rapid antigen test | 499 (26%) | 379 (20%) | 971 (51%) | 17 (0.9%) | 39 (2.0%) | 1.905 (100%) |
| That depends on medical advice or the advice of another health service | 236 (33%) | 315 (44%) | 91 (13%) | 34 (4.7%) | 42 (5.8%) | 718 (100%) |
| Don’t know | 26 (24%) | 42 (39%) | 6 (5.5%) | 14 (13%) | 21 (19%) | 109 (100%) |
| Total | 3.288 (31%) | 4.925 (46%) | 1.875 (17%) | 164 (1.5%) | 492 (4.6%) | 10.744 (100%) |
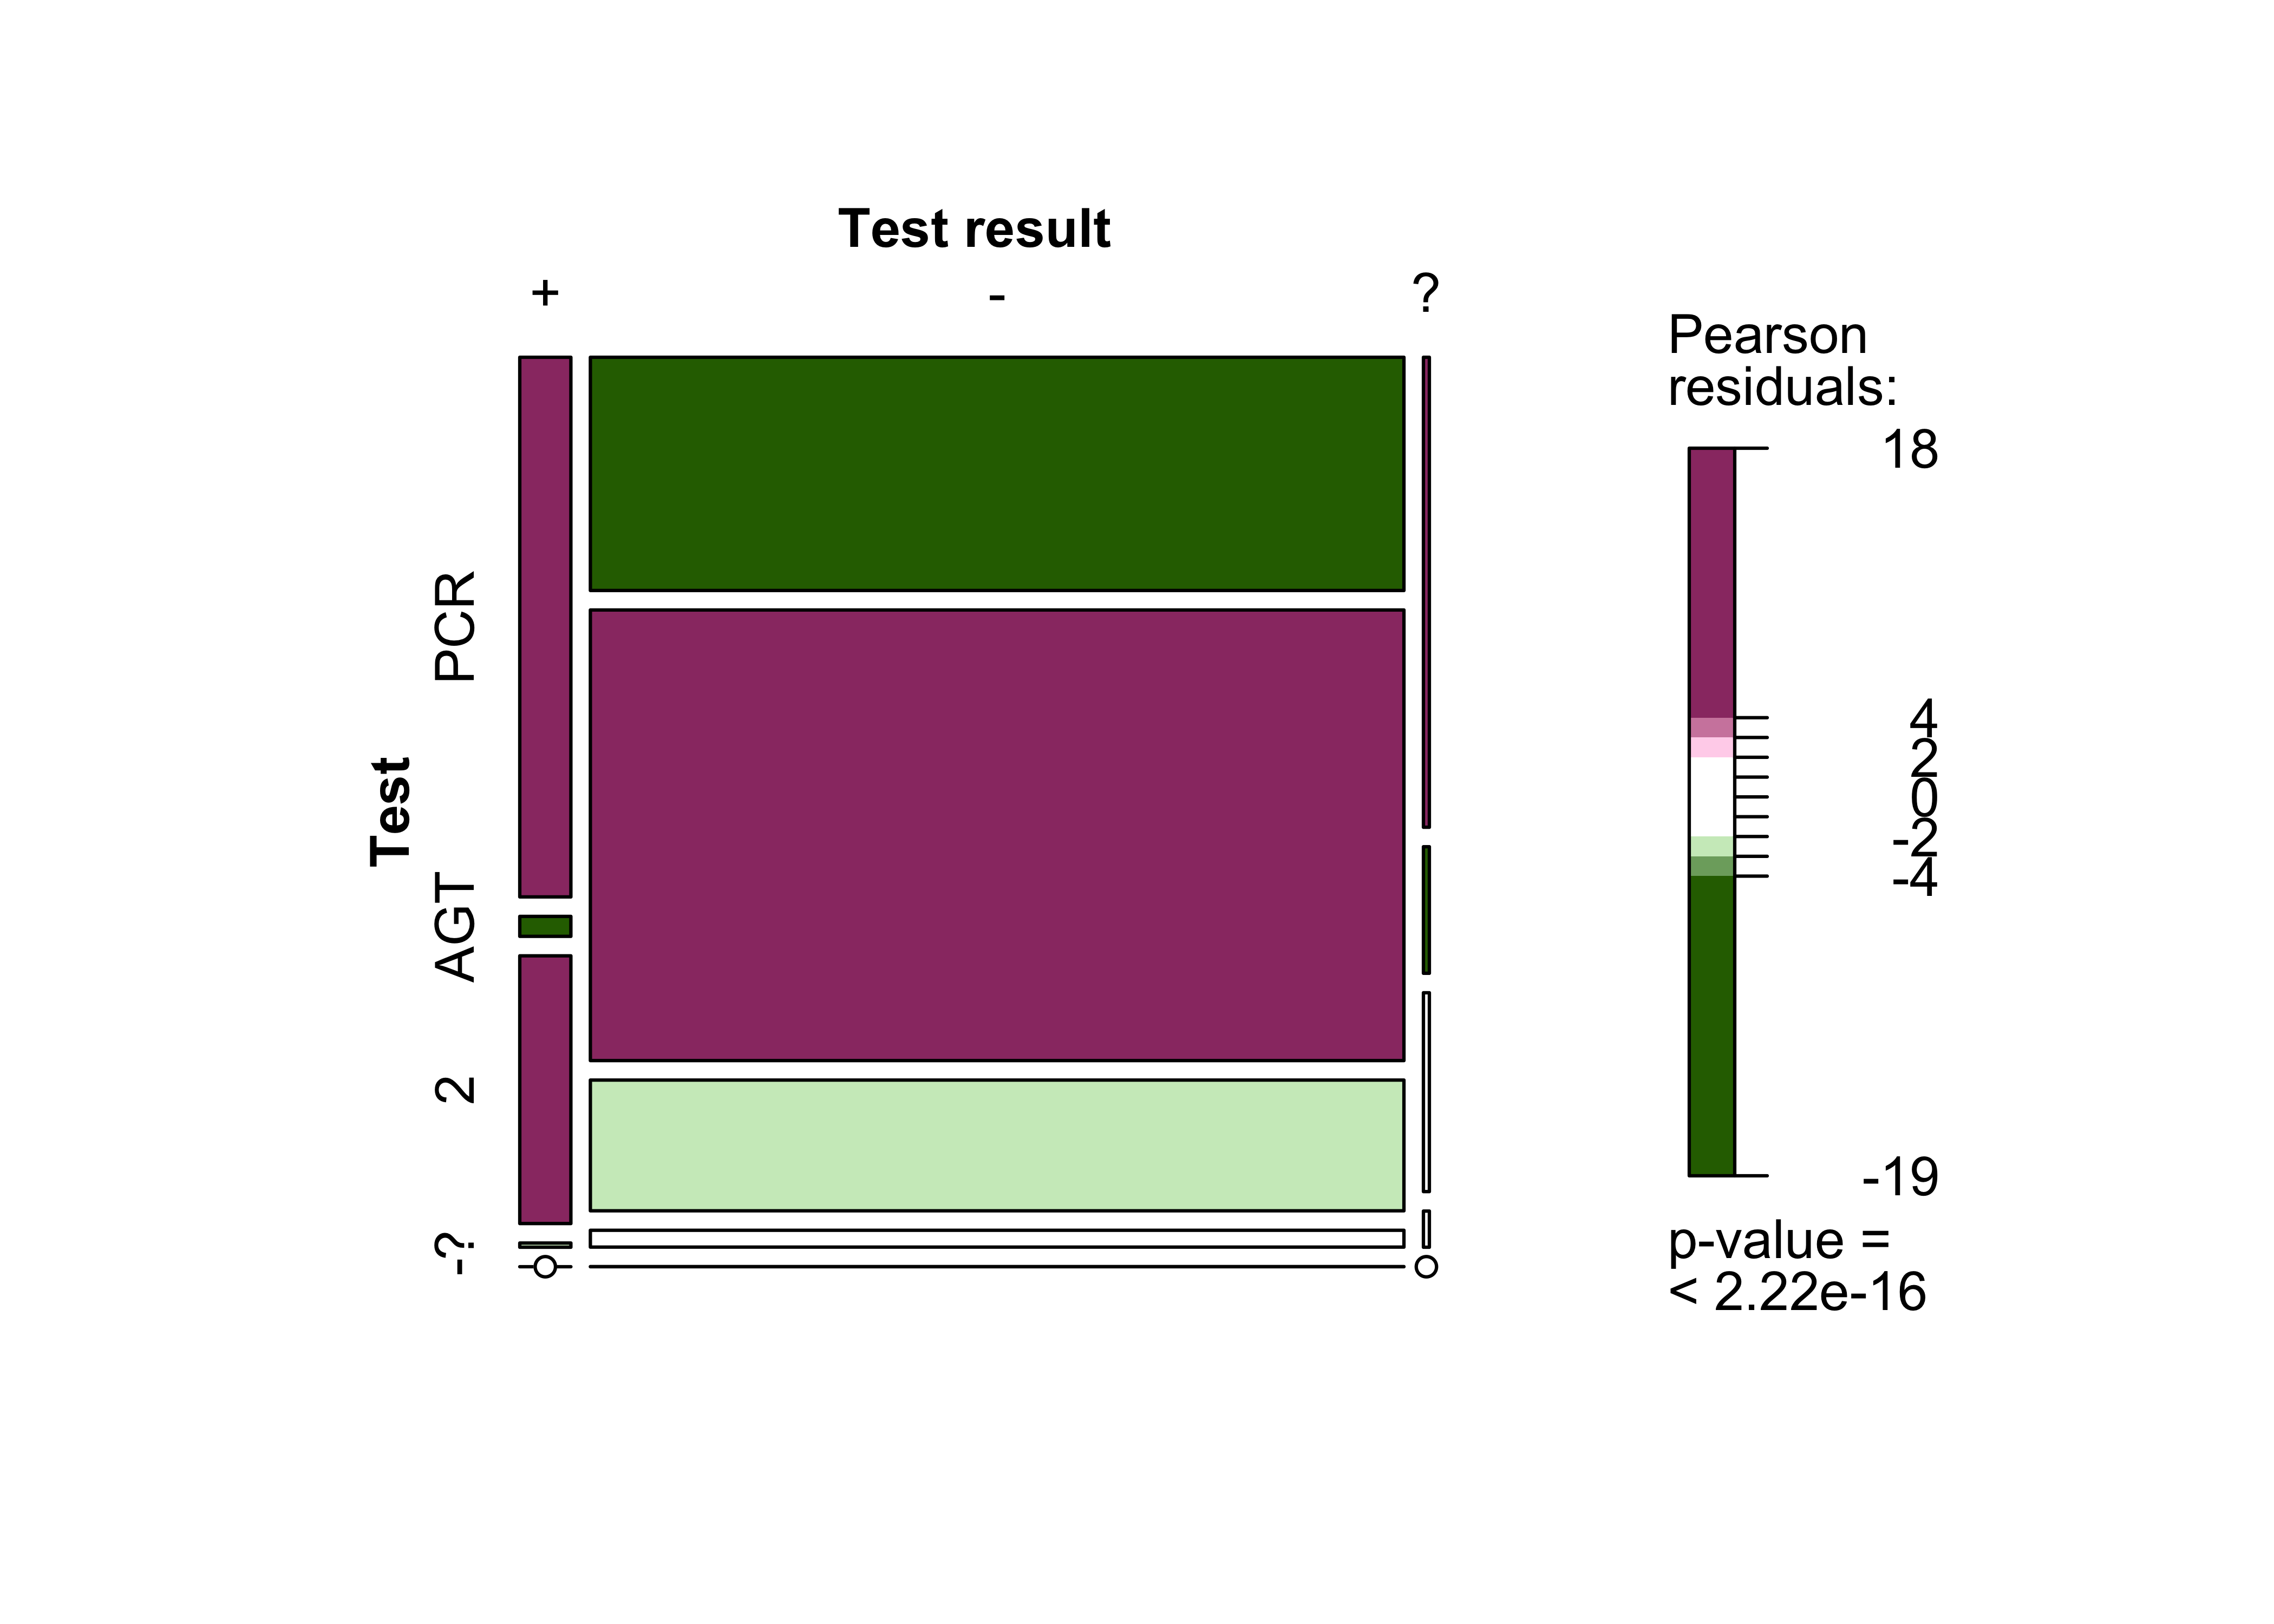
5.9% of respondents who went for testing (follow-up survey) tested positive. 93.4% tested negative, and 0.4% received inconclusive results. PCR tests led to the highest proportion of positive results.
| Variable | Test result | Total | ||
|---|---|---|---|---|
| Positive for SARS-CoV-2 | Negative for SARS-CoV-2 | Inconclusive | ||
| Test (carried out) | ||||
| Yes, a PCR test | 514 (65%) | 3.536 (28%) | 52 (57%) | 4.102 (30%) |
| Yes, a rapid antigen test | 19 (2.4%) | 6.832 (54%) | 14 (15%) | 6.865 (51%) |
| Yes, a PCR test and a rapid antigen test | 255 (32%) | 1.982 (16%) | 22 (24%) | 2.259 (17%) |
| Yes, but I don’t know, what kind of test | 4 (0.5%) | 255 (2.0%) | 4 (4.3%) | 263 (1.9%) |
| No | 0 (0%) | 2 (<0.1%) | 0 (0%) | 2 (<0.1%) |
| Total | 792 (100%) | 12.607 (100%) | 92 (100%) | 13.491 (100%) |
Details of test results
| Did you have a SARS-CoV-2 test carried out after receiving a "red warning" message from the Corona-Warn-App? | Number | Percentage | Percentage (valid) |
|---|---|---|---|
| Yes, a PCR test | 4.118 | 15.8% | 26.5% |
| Yes, a rapid antigen test | 6.868 | 26.3% | 44.2% |
| Yes, a PCR test and a rapid antigen test | 2.263 | 8.7% | 14.6% |
| Yes, but I don’t know what kind of test 266 1.0% 1.7% | 266 | 1.0% | 1.7% |
| No | 2.025 | 7.8% | 13.0% |
| - not specified - | 10.554 | 40.4% |
| How was your test result? | Number | Percentage | Percentage (valid) |
|---|---|---|---|
| Positive for SARS-CoV-2 | 792 | 3.0% | 5.9% |
| Negative for SARS-CoV-2 | 12.609 | 48.3% | 93.4% |
| Inconclusive | 92 | 0.4% | 0.7% |
| -not specified- | 12.601 | 48.3% |
On average, users underwent testing 2.5 days after receiving a red warning
. This is relatively early, considering that the median incubation period is 5 to 6 days. PCR tests can detect infections at an earlier stage and are more reliable than rapid antigen tests. This could help explain the high rate of positive PCR tests. It can also be assumed that people opted for rapid antigen tests because they are free. The large uptake of rapid antigen tests and the early average time of testing are areas that could be improved by better informing app users.
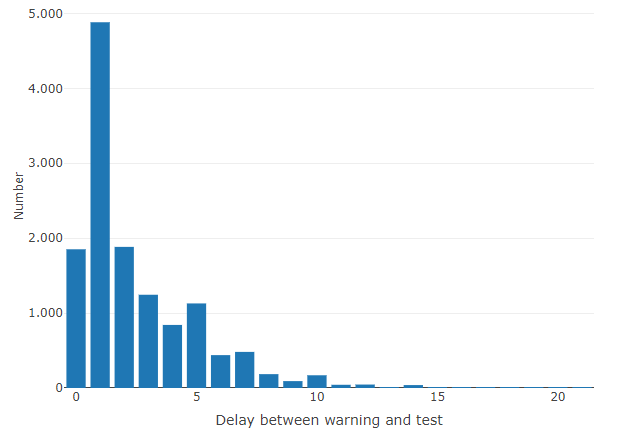
Fig. 12: EDUS - Delay between red warning
and test
Information on delays from a red warning
to test result
How many days after receiving a red warningmessage from the Corona-Warn-App did you have yourself tested? |
Number | Percentage | Percentage (valid) |
|---|---|---|---|
| 0 | 1.852 | 7.1% | 13.9% |
| 1 | 4.883 | 18.7% | 36.6% |
| 2 | 1.884 | 7.2% | 14.1% |
| 3 | 1.245 | 4.8% | 9.3% |
| 4 | 842 | 3.2% | 6.3% |
| 5 | 1.129 | 4.3% | 8.5% |
| 6 | 439 | 1.7% | 3.3% |
| 7 | 482 | 1.8% | 3.6% |
| 8 | 185 | 0.7% | 1.4% |
| 9 | 92 | 0.4% | 0.7% |
| 10 | 170 | 0.7% | 1.3% |
| 11 | 43 | 0.2% | 0.3% |
| 12 | 46 | 0.2% | 0.3% |
| 13 | 11 | 0.0% | 0.1% |
| 14 | 39 | 0.1% | 0.3% |
| 15 | 4 | 0.0% | 0.0% |
| 16 | 2 | 0.0% | 0.0% |
| 17 | 4 | 0.0% | 0.0% |
| 18 | 1 | 0.0% | 0.0% |
| 19 | 1 | 0.0% | 0.0% |
| 20 | 1 | 0.0% | 0.0% |
| 21 | 2 | 0.0% | 0.0% |
| 30 | 1 | 0.0% | 0.0% |
| 50 | 1 | 0.0% | 0.0% |
| NA | 12.735 | 48.8% |
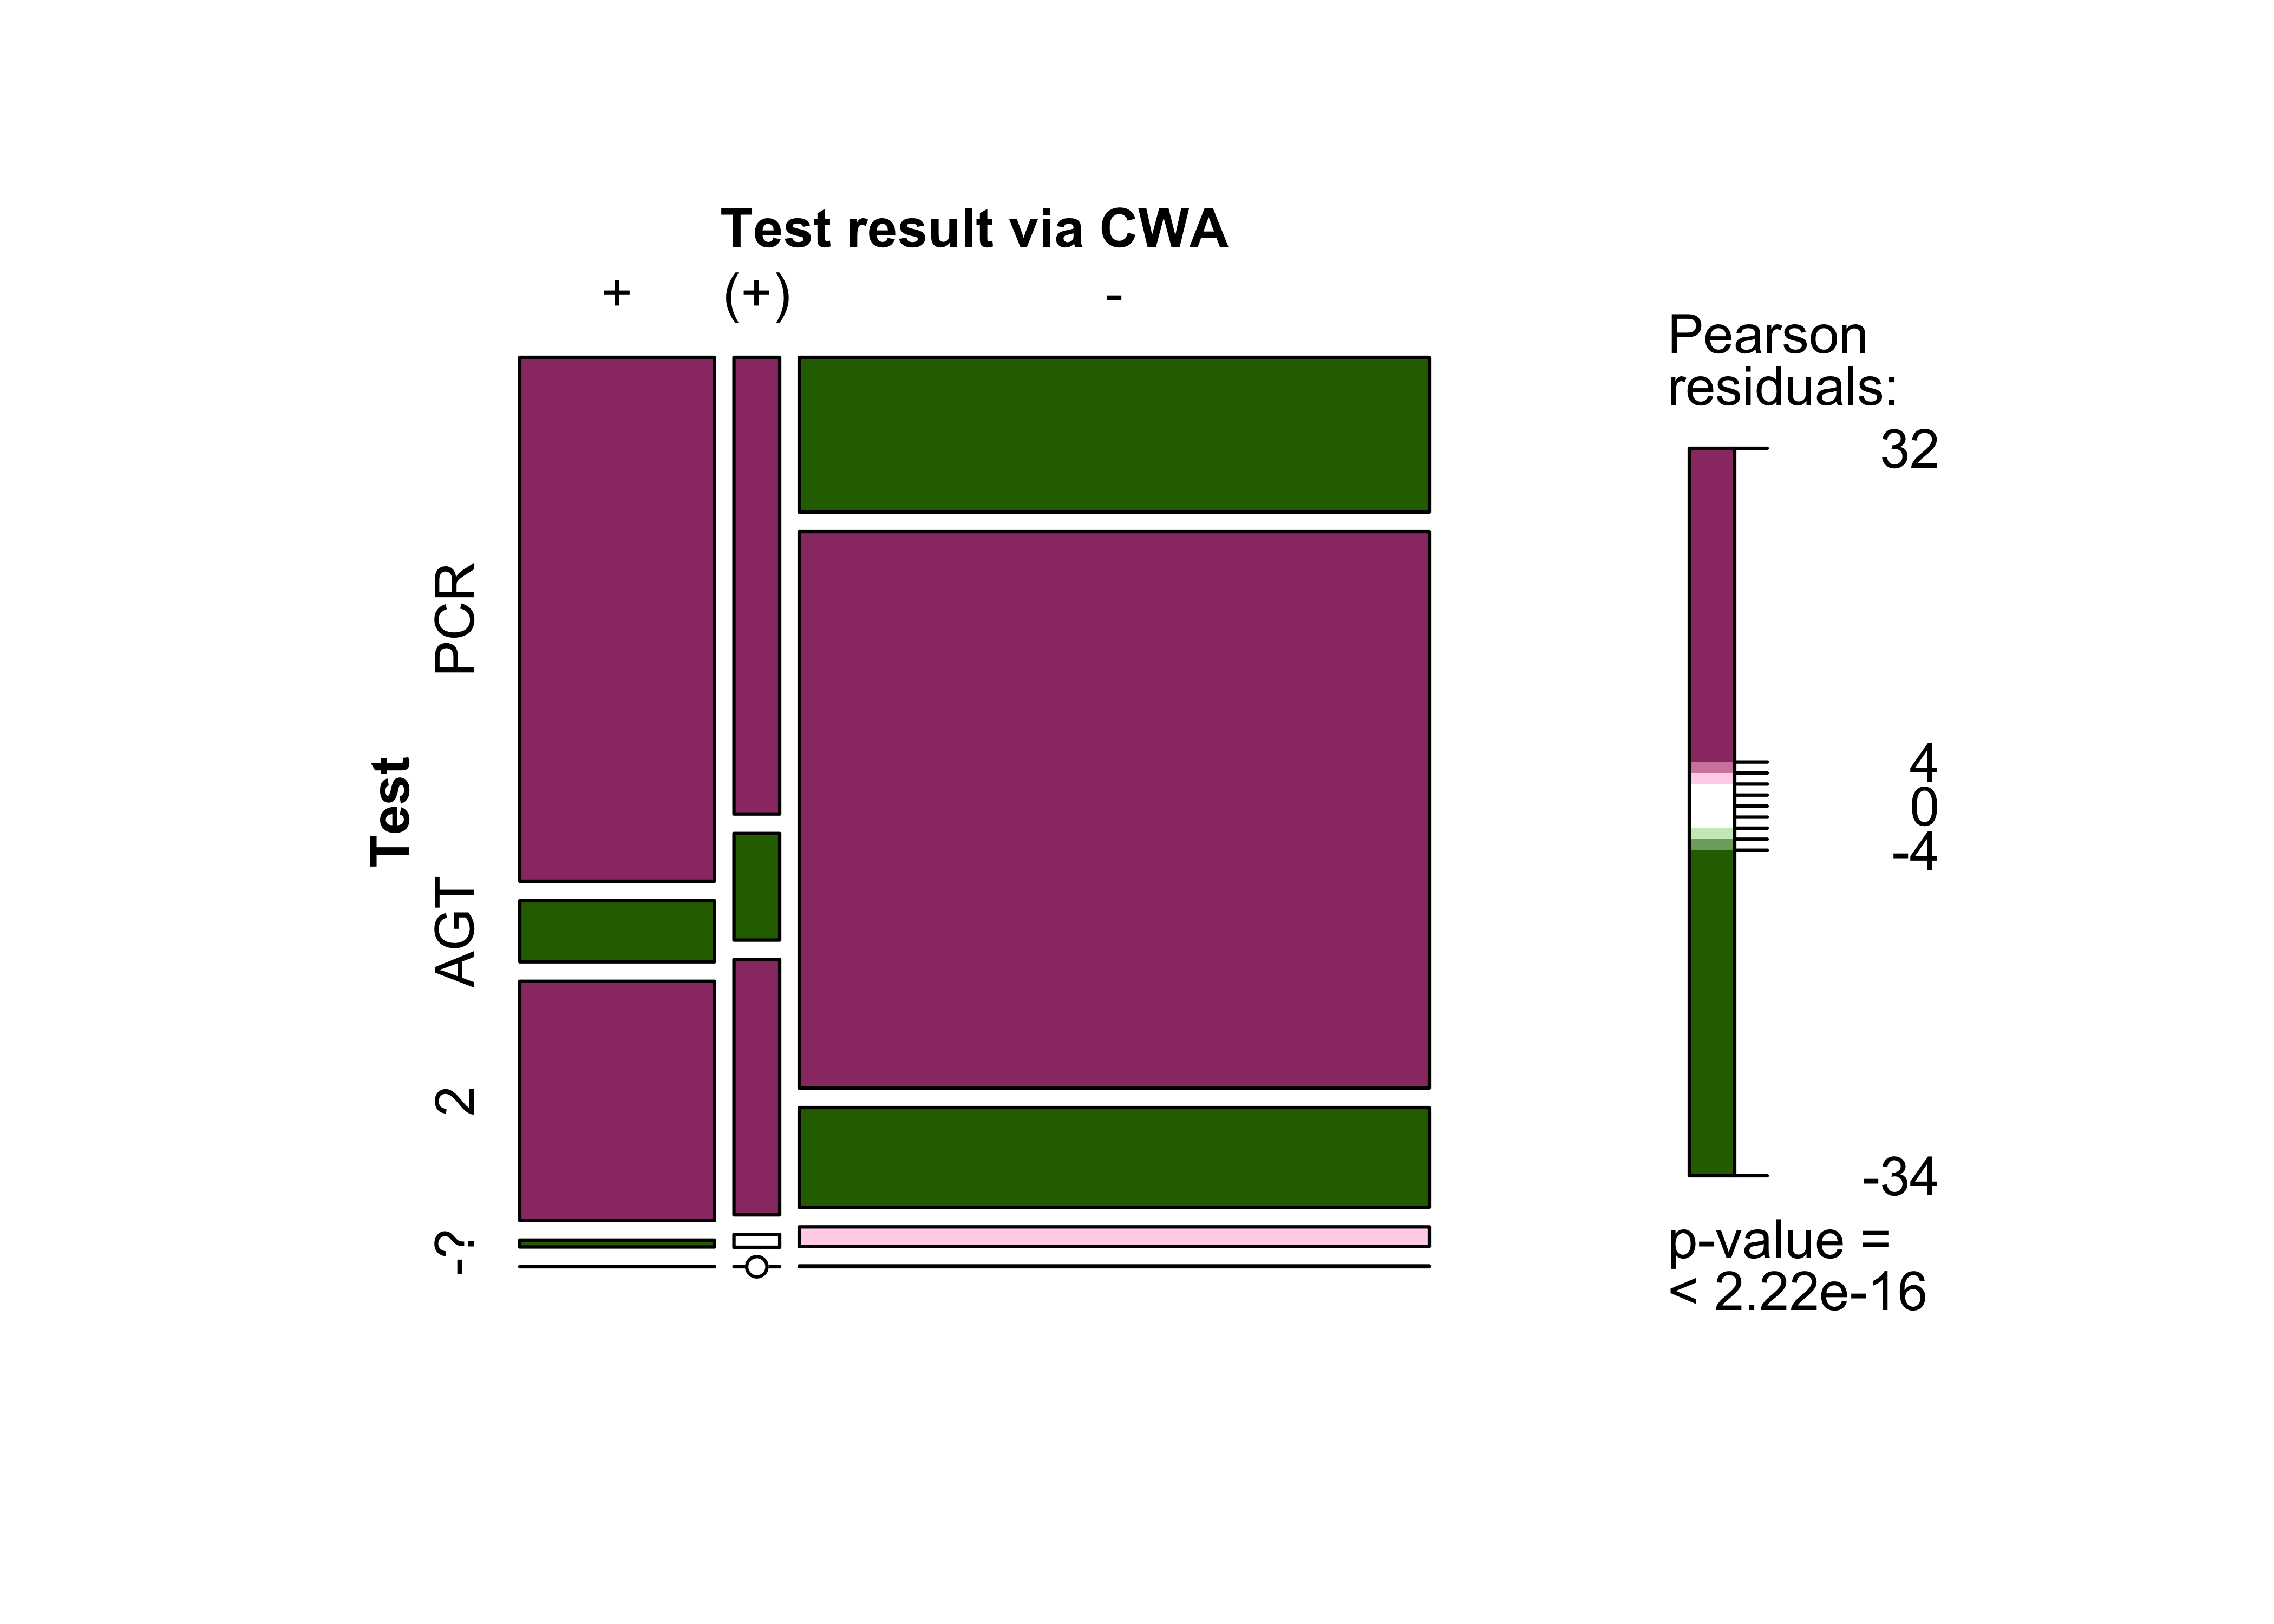
During the main survey period (March to May 2021), only PCR tests could be registered in the CWA. This explains why only 22.4% of participants in the follow-up survey received their result via the app. 46.3% of users who stated that they had undergone a PCR test shared their result via the app. It has been possible to register the results of rapid antigen tests with the app since the beginning of May, although it should be assumed that most test centres will have taken more time to implement this service. 2.7% of the respondents had already received their results from elsewhere by the time they had received them via the app.
| Variable | Test result via CWA | Total | ||
|---|---|---|---|---|
| Yes | Yes, but only after I had already received the result from another source | No | ||
| Test (carried out) | ||||
| Yes, a PCR test | 1.905 (46%) | 390 (9.5%) | 1.822 (44%) | 4.117 (100%) |
| Yes, a rapid antigen test | 222 (3.2%) | 91 (1.3%) | 6.549 (95%) | 6.862 (100%) |
| Yes, a PCR test and a rapid antigen test | 870 (38%) | 218 (9.6%) | 1.174 (52%) | 2.262 (100%) |
| Yes, but I don’t know what kind of test | 25 (9.4%) | 11 (4.1%) | 230 (86%) | 266 (100%) |
| No | 1 (9.1%) | 0 (0%) | 10 (91%) | 11 (100%) |
| Total | 3.023 (22%) | 710 (5.3%) | 9.785 (72%) | 13.518 (100%) |
Users who received their results via the app usually received them within 24 hours or two days after the test had been carried out. The results suggest that it is not just the app that works quickly but the entire reporting chain.
Information on the provision of test results via the Corona-Warn-App
| Did you receive your test result via the Corona-Warn-App (after scanning the QR code of your test document)? | Number | Percentage | Percentage (valid) |
|---|---|---|---|
| Yes | 3.023 | 11.6% | 22.4% |
| Yes, but only after I had already received the result from another source | 710 | 2.7% | 5.3% |
| No | 9.787 | 37.5% | 72.4% |
| -not specified- | 12.574 | 48.2% |
| How quickly was your test result transmitted via the Corona-Warn-App after the test was carried out? | Number | Percentage | Percentage (valid) |
|---|---|---|---|
| Within 24 hours | 2.344 | 9.0% | 62.7% |
| Within 2 days | 1.025 | 3.9% | 27.4% |
| Within 3 days | 147 | 0.6% | 3.9% |
| More than 3 days | 85 | 0.3% | 2.3% |
| Don’t know | 136 | 0.5% | 3.6% |
| -not specified - | 22.357 | 85.7% |
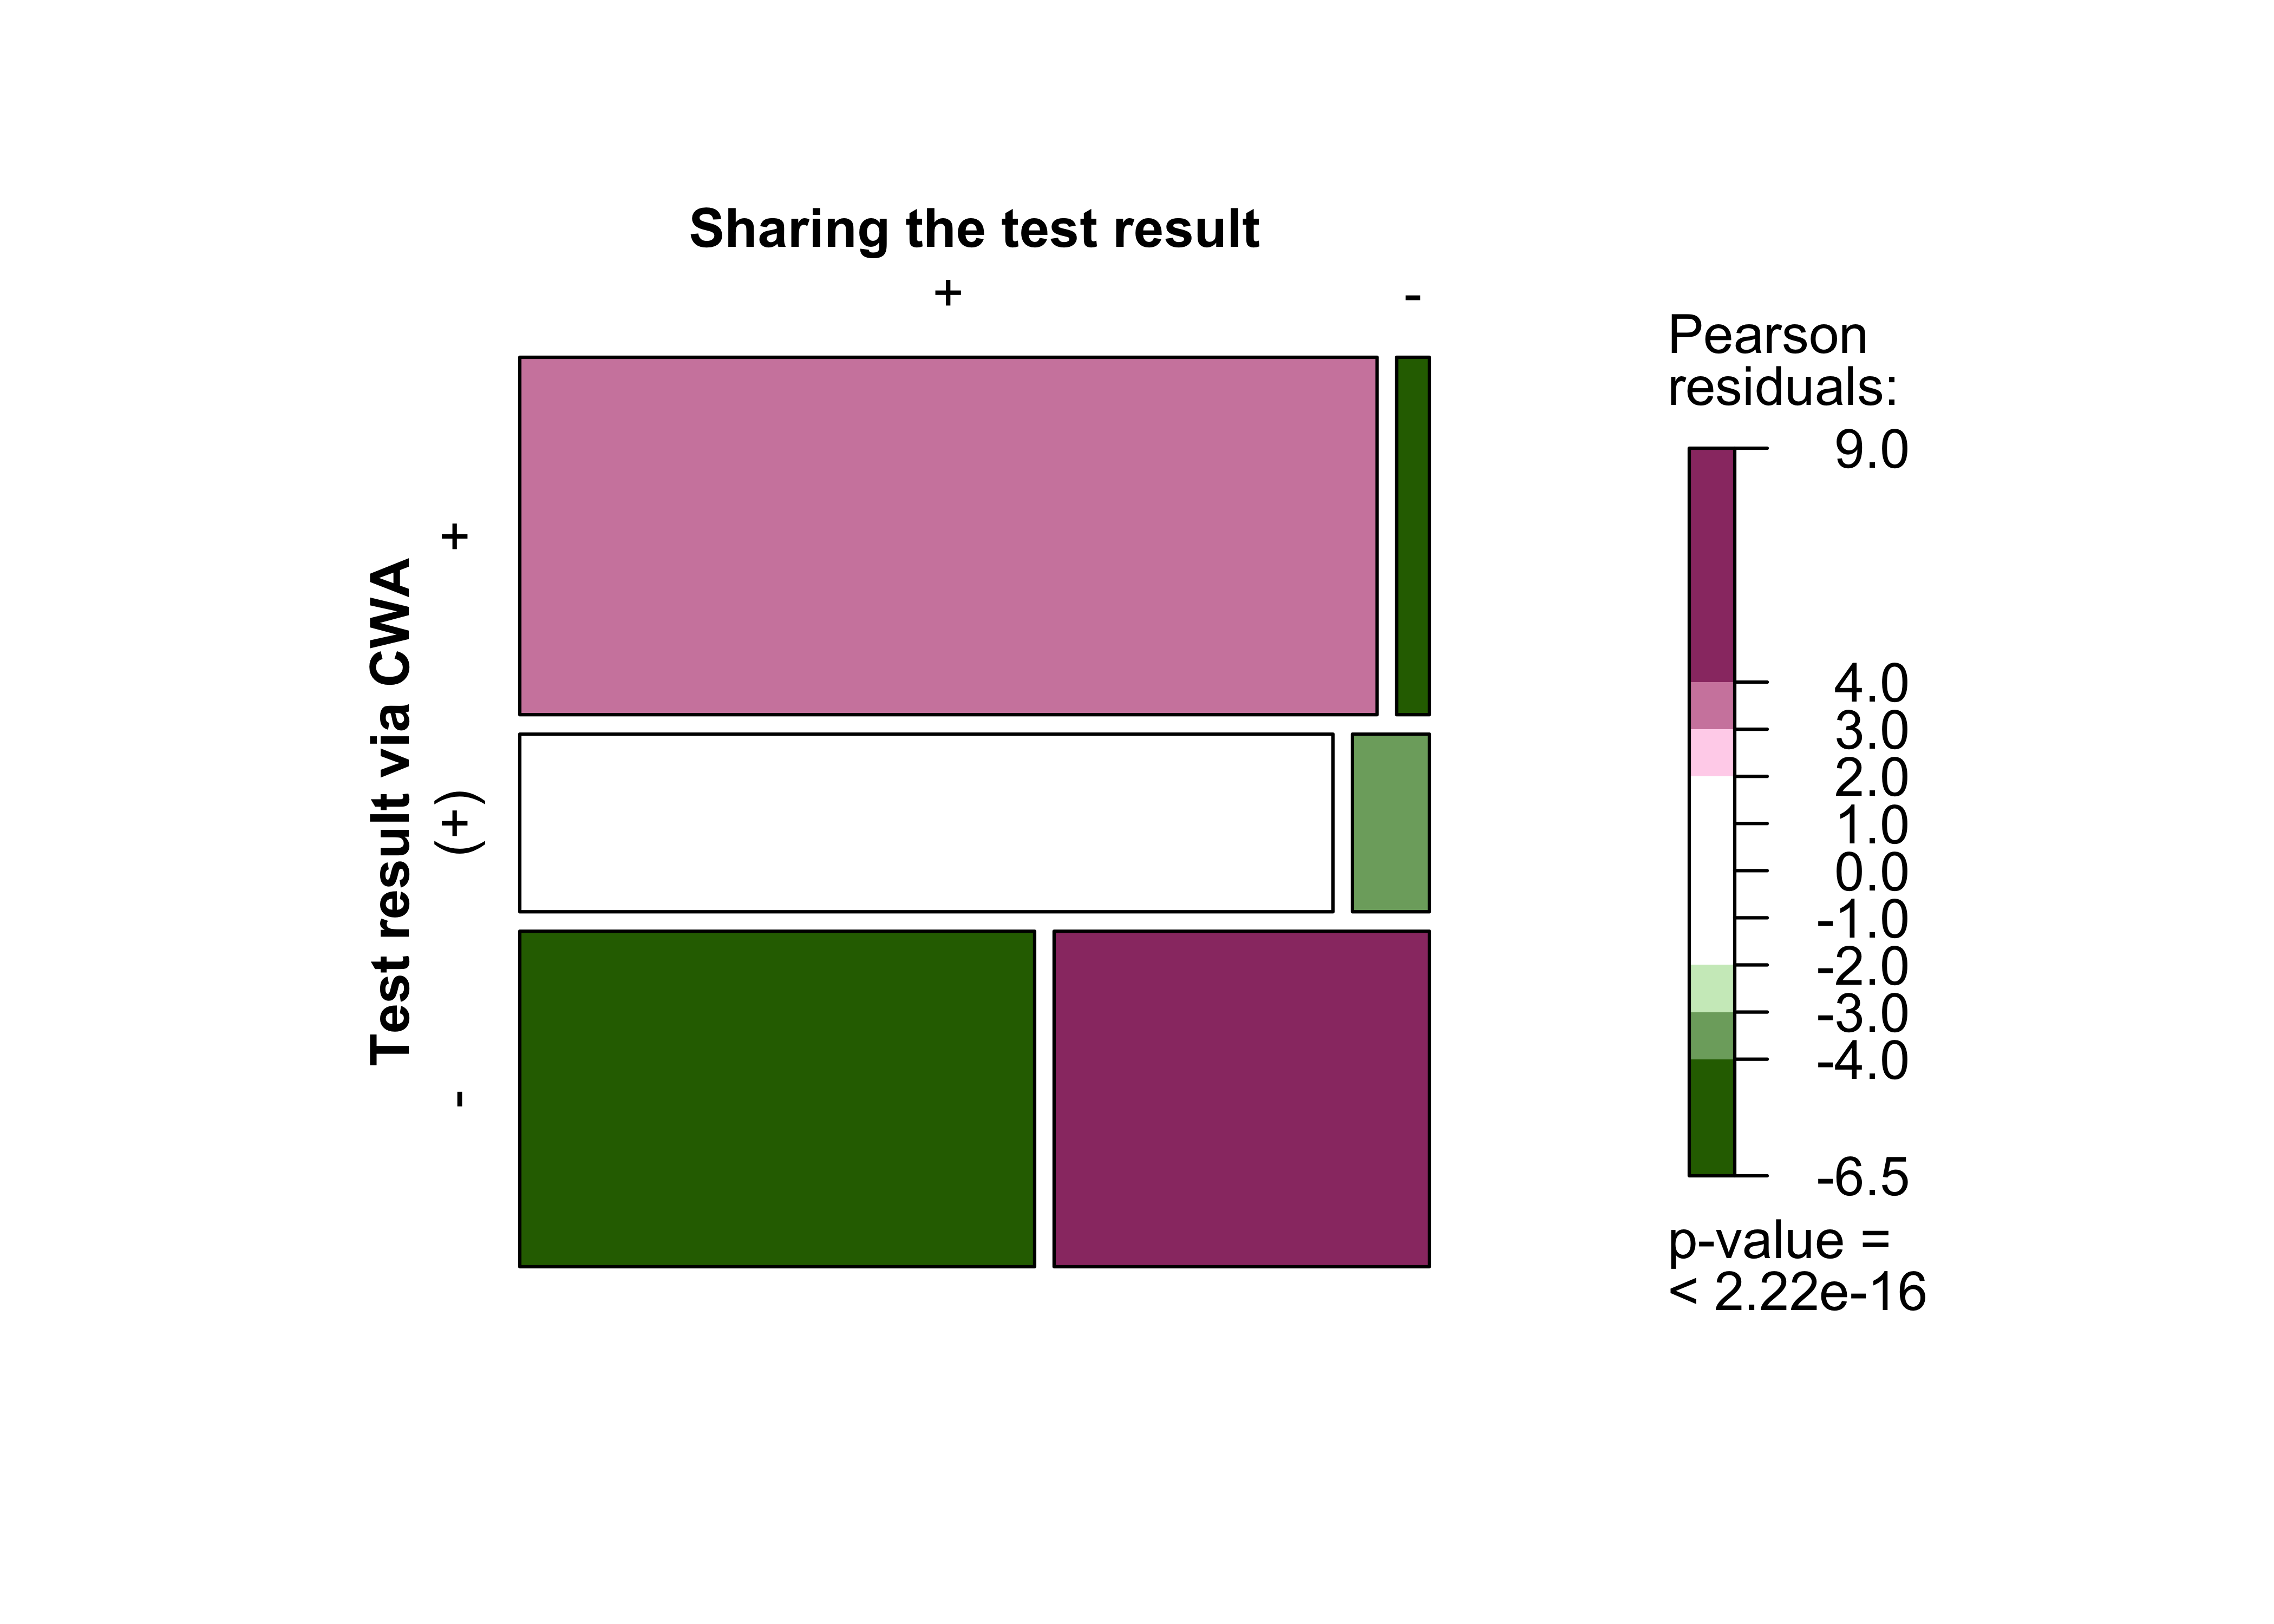
4.3 Sharing of test results
Of the app users who tested positive, 80.3% shared their result via the app and, therefore, warned other people. The ability to warn other users is a core function and it relies on the willingness of app users to share their positive test results. Data from the follow-up survey demonstrate that the majority of users who tested positive were indeed willing to share their result: just 19.5% of respondents chose not to do so. Moreover, respondents who had registered a test via the app were often more willing to share a positive test result.
Information on the sharing of test results
| Did you share your positive test result via the Corona-Warn-App? | Number | Percentage | Percentage (valid) |
|---|---|---|---|
| Yes | 639 | 2.4% | 80.5% |
| No | 155 | 0.6% | 19.5% |
| -not specified- | 25.300 | 97.0% |
Respondents who had registered the test in the Corona-Warn-App were more often willing to share a positive test result.
| Variable | Sharing the test result | Total | |
|---|---|---|---|
| Yes | No | ||
| Test registration via CWA | |||
| Yes | 314 (40%) | 12 (1.5%) | 326 (41%) |
| Yes, but only after I had already received the result from another source | 148 (19%) | 14 (1.8%) | 162 (20%) |
| No | 177 (22%) | 129 (16%) | 306 (39%) |
| Total | 639 (80%) | 155 (20%) | 794 (100%) |
No statistically significant differences were identified by sex, age or education. However, the group of respondents who tested positive and, therefore, were asked whether they had shared their positive result (n = 792) is too small to use for reliable statistical calculations.
4.4 Overview of the test process
The following interactive graphic (Sankey diagram) breaks down the responses to testing using data from the basic and follow-up questionnaires. Sankey diagrams are a specific type of flowchart. Flow rates are represented by arrows that are proportional in size to the quantity they represent; the thickness of the arrows represents the true-to-scale quantity. The flows run between two nodes that act as intermediate stages and, for example, provide information about the structure of the system they describe.
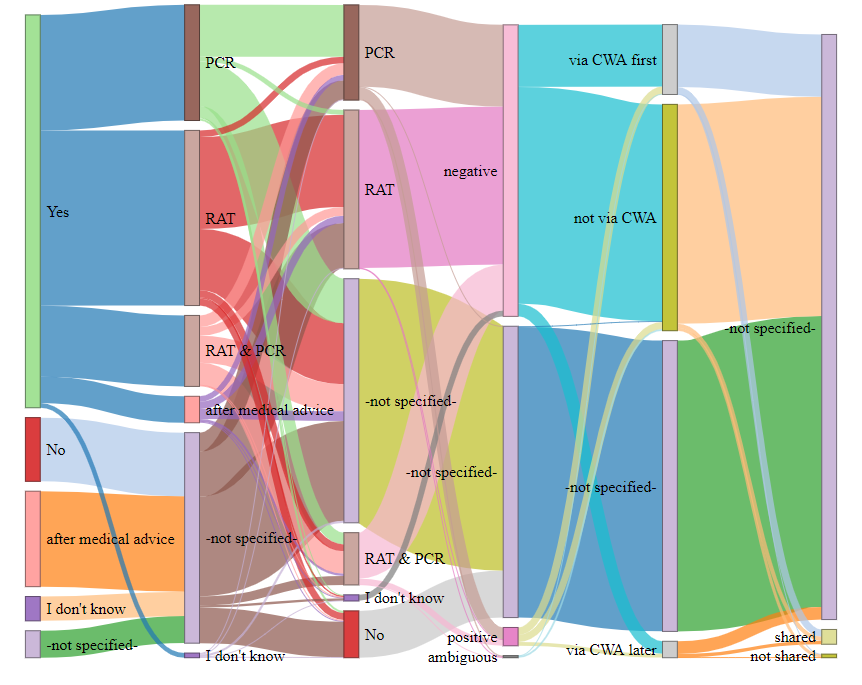
Fig. 15: EDUS – CWA test process, from test intention to test type, actual tests carried out, test results and receiving test results via the CWA to distribution.
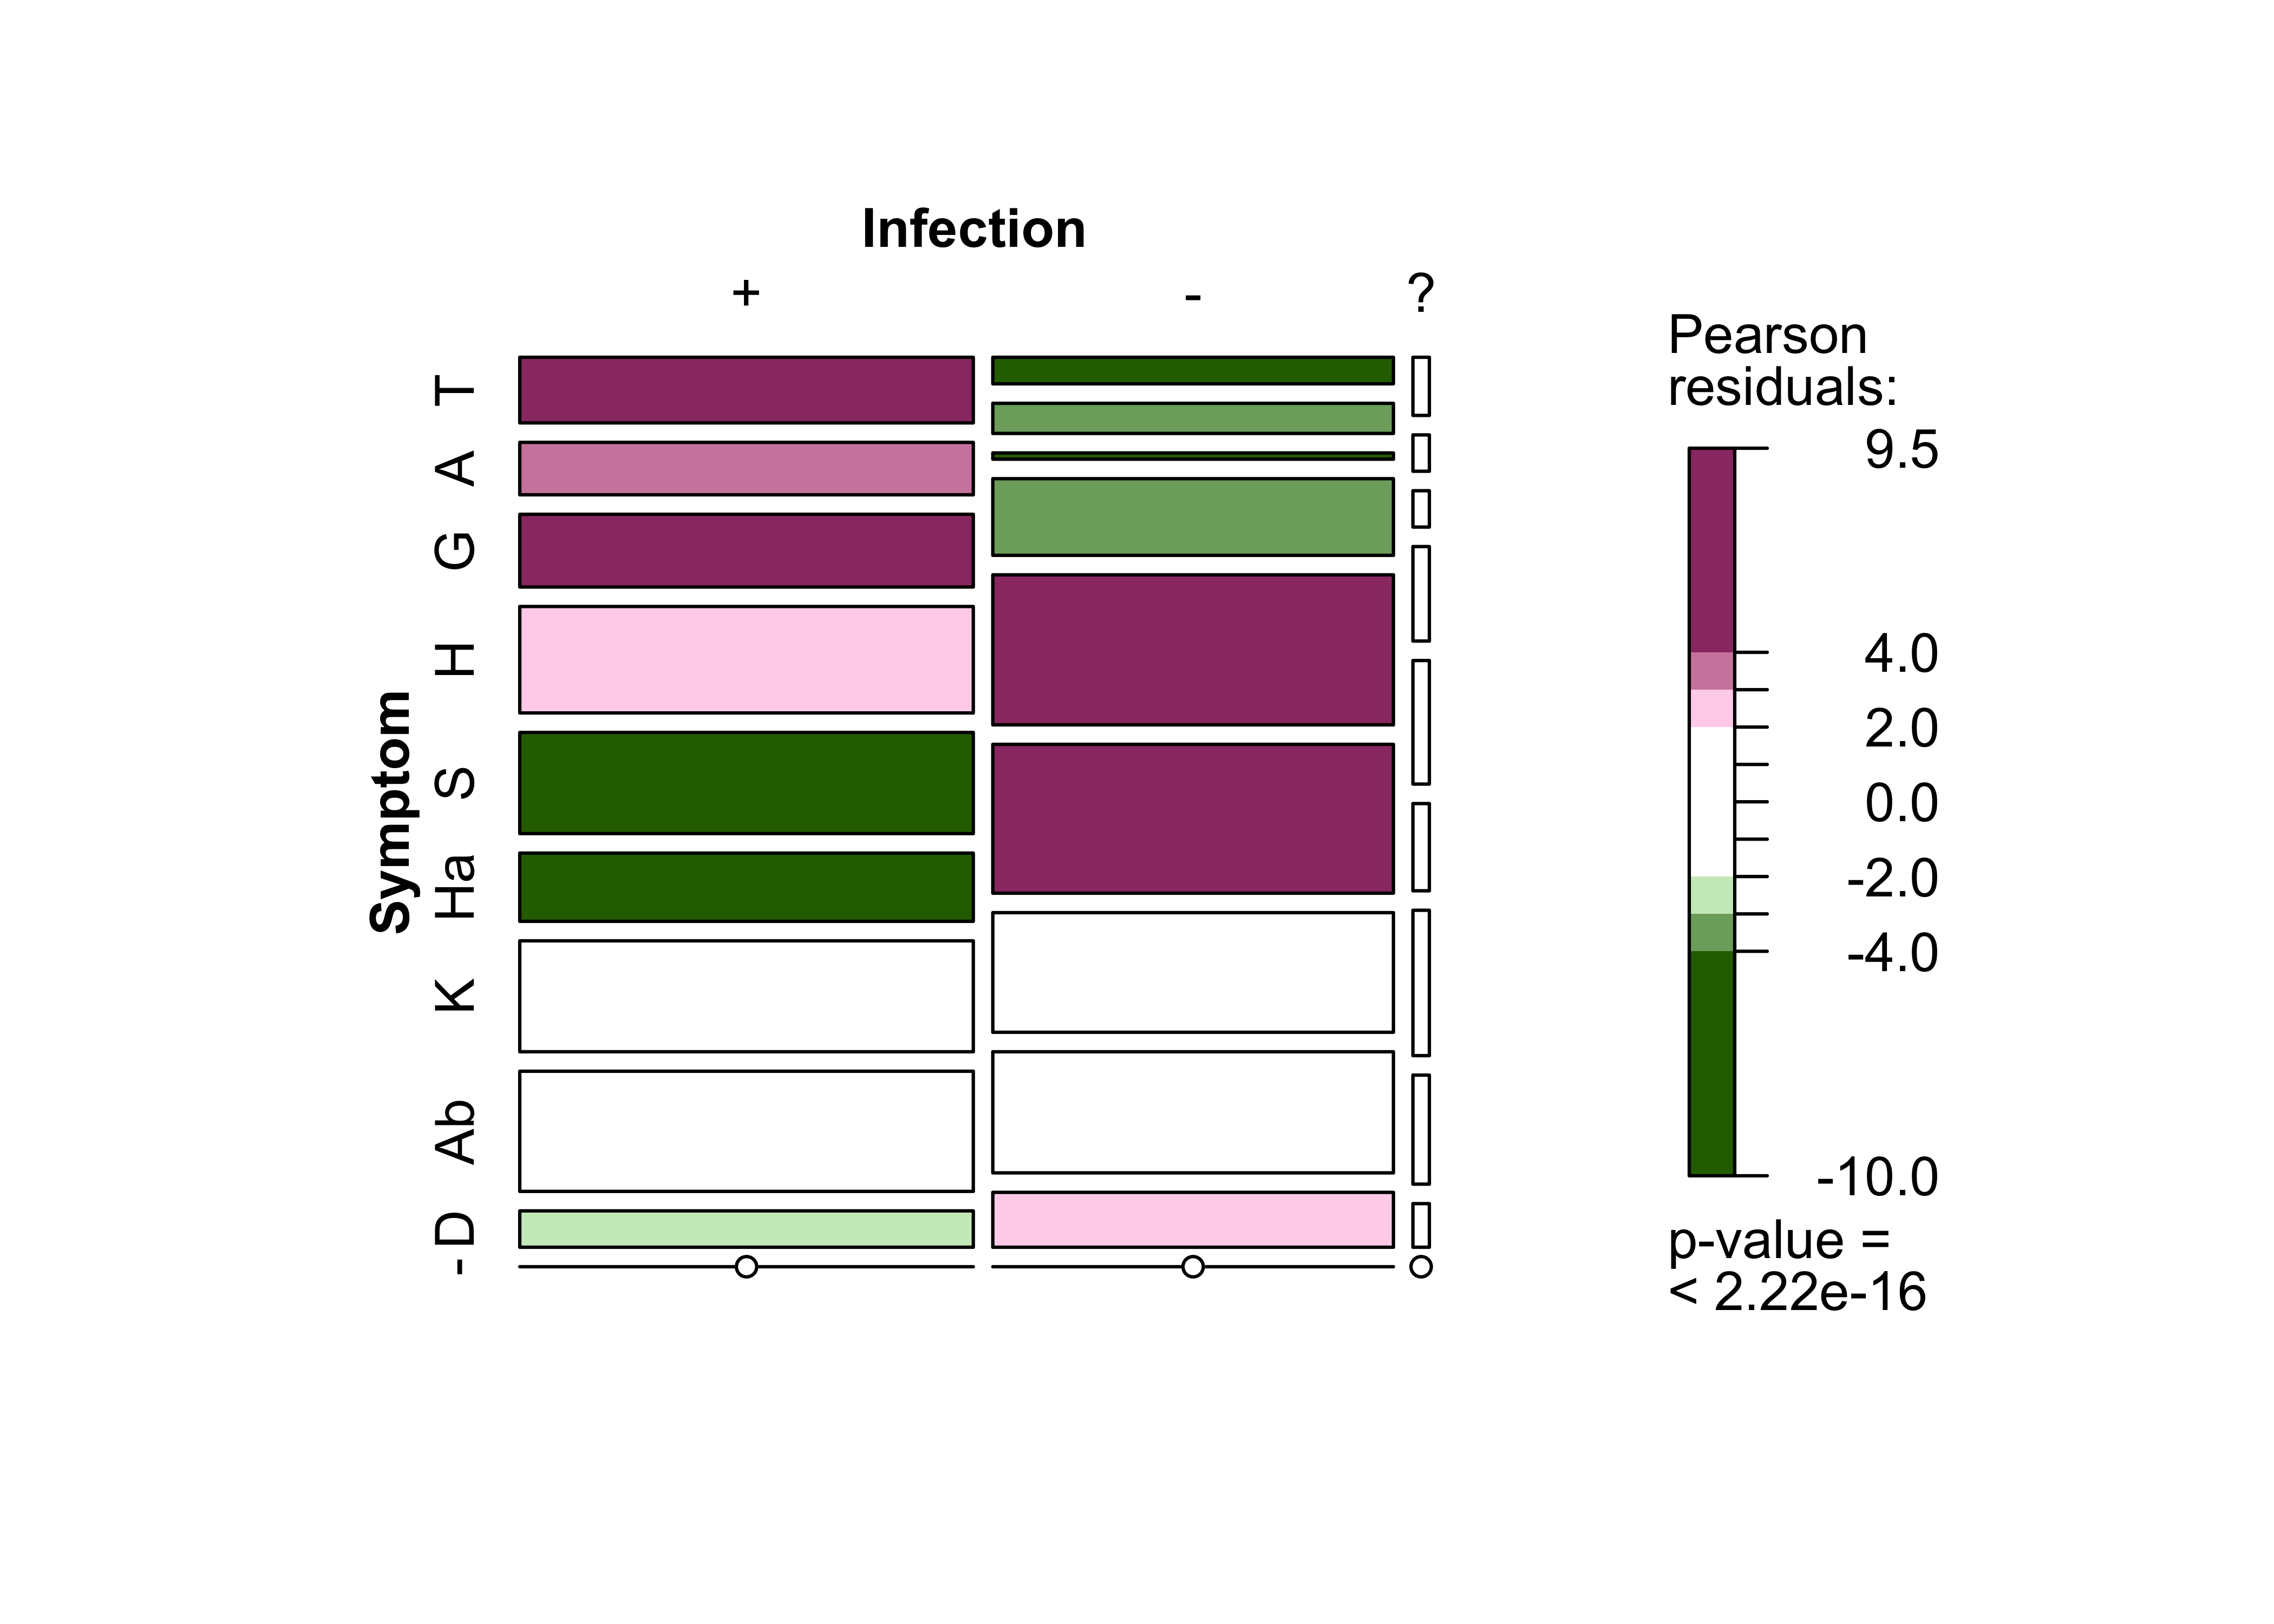
5 Symptoms
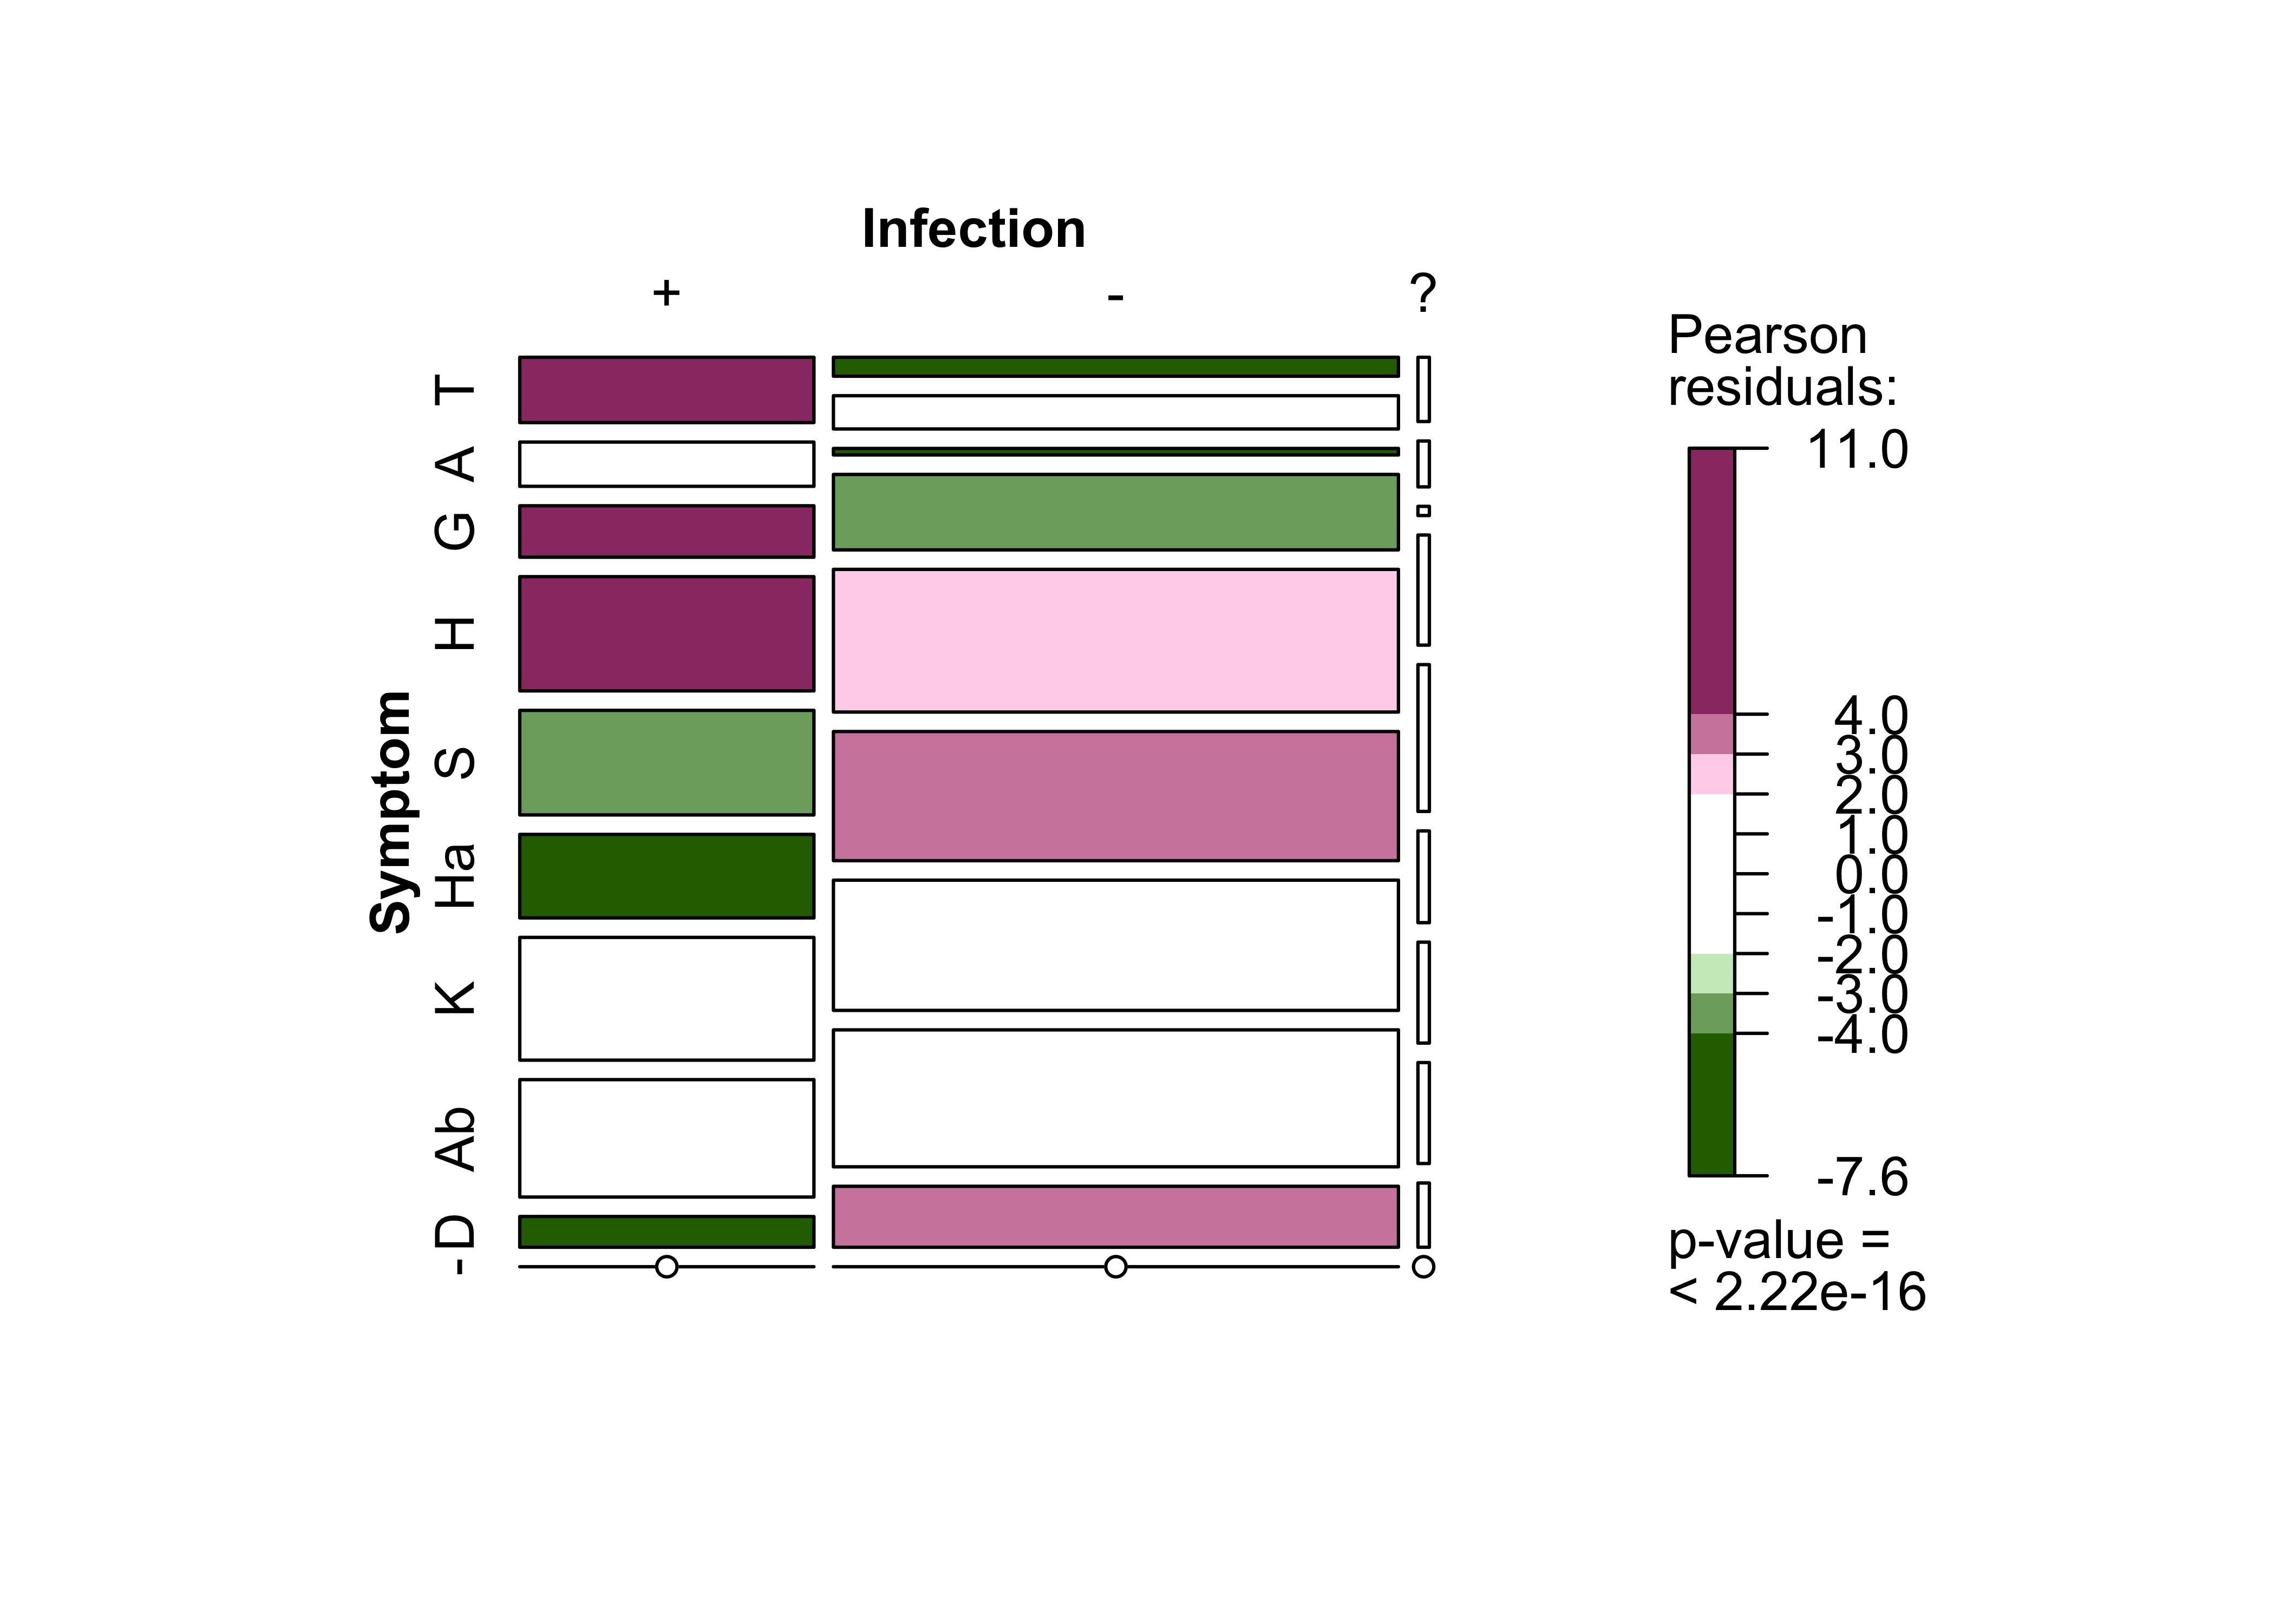
The last block dealt with the symptoms of users who tested positive. The basic survey asked users to report new symptoms that had appeared during the last few days. The follow-up survey focused on new symptoms that developed after the warning message had been received, and when they occurred. In both cases there was an option to select multiple symptoms. Most respondents reported that no new symptoms had developed in the days before the basic survey. Users who reported new symptoms were most likely to have non-specific symptoms such as runny nose, general weakness, and headache and other pains. Loss of smell/taste, the most reliable symptom of COVID-19, was reported the least. However, 80% of respondents who did report this symptom went on to test positive for SARS-CoV-2. For comparison: only 27.2% of respondents who reported a runny nose later tested positive.
Relationship between information on symptoms in the basic survey and test result
| Variable | Test result | Total | ||
|---|---|---|---|---|
| Positive for SARS-CoV-2 | Negative for SARS-CoV-2 | Inconclusive | ||
| Symptom | ||||
| Elevated temperature or fever | 183 (63%) | 102 (35%) | 7 (2.4%) | 292 (100%) |
| Shortness of breath | 124 (40%) | 179 (58%) | 5 (1.6%) | 308 (100%) |
| Loss of smell / taste | 144 (80%) | 35 (19%) | 1 (0.6%) | 180 (100%) |
| Cough | 320 (43%) | 406 (55%) | 12 (1.6%) | 738 (100%) |
| Cold | 293 (27%) | 768 (71%) | 16 (1.5%) | 1.077 (100%) |
| Sore throat | 234 (25%) | 695 (74%) | 10 (1.1%) | 939 (100%) |
| Headache and limb pain | 344 (33%) | 701 (66%) | 11 (1.0%) | 1.056 (100%) |
| General weakness and fatigue | 329 (31%) | 737 (68%) | 11 (1.0%) | 1.077 (100%) |
| Diarrhea | 86 (20%) | 328 (78%) | 7 (1.7%) | 421 (100%) |
| No, none of the symptoms mentioned | 277 (2.6%) | 10.500 (97%) | 62 (0.6%) | 10.839 (100%) |
| Total | 2.334 (14%) | 14.451 (85%) | 142 (0.8%) | 16.927 (100%) |
The distribution of the responses to the follow-up survey was only slightly different to the basic survey. Slightly more respondents reported no new symptoms. Once again, the most common category was unspecific symptoms. Only the loss of the sense of smell/taste was reported more frequently in percentage terms than in the basic survey. 91.4% of respondents with this symptom (follow-up study) also tested positive for SARS-CoV-2. Fever remained at the same level across the surveys.
Relationship between information on symptoms in the follow-up survey and test result
| Variable | Test result | Total | ||
|---|---|---|---|---|
| Positive for SARS-CoV-2 | Negative for SARS-CoV-2 | Inconclusive | ||
| Symptom | ||||
| Elevated temperature or fever | 249 (72%) | 89 (26%) | 8 (2.3%) | 346 (100%) |
| Shortness of breath | 199 (65%) | 101 (33%) | 5 (1.6%) | 305 (100%) |
| Loss of smell / taste | 276 (91%) | 21 (7.0%) | 5 (1.7%) | 302 (100%) |
| Cough | 404 (60%) | 257 (38%) | 13 (1.9%) | 674 (100%) |
| Cold | 384 (42%) | 503 (56%) | 17 (1.9%) | 904 (100%) |
| Sore throat | 259 (34%) | 499 (65%) | 12 (1.6%) | 770 (100%) |
| Headache and limb pain | 421 (50%) | 401 (48%) | 20 (2.4%) | 842 (100%) |
| General weakness and fatigue | 456 (52%) | 406 (46%) | 15 (1.7%) | 877 (100%) |
| Diarrhea | 138 (42%) | 184 (56%) | 6 (1.8%) | 328 (100%) |
| No, none of the symptoms mentioned | 155 (1.3%) | 11.297 (98%) | 59 (0.5%) | 11.511 (100%) |
| Total | 2.941 (17%) | 13.758 (82%) | 160 (0.9%) | 16.859 (100%) |
Respondents who reported new symptoms in the follow-up survey were asked to indicate when the symptoms first developed. Over two thirds of these users reported that the symptoms had appeared more than three days ago.
Information on symptoms in the basic and follow-up survey
| Have you experienced one or more of the following new symptoms in the last few days? | Number | Percentage |
|---|---|---|
| Elevated temperature or fever | 577 | 2.3% |
| Shortness of breath | 671 | 2.7% |
| Loss of smell / taste | 382 | 1.5% |
| Cough | 1.470 | 5.9% |
| Cold | 2.062 | 8.3% |
| Sore throat | 1.665 | 6.7% |
| Headache and limb pain | 1.980 | 7.9% |
| General weakness and fatigue | 2.019 | 8.1% |
| Diarrhea | 827 | 3.3% |
| No, none of the symptoms mentioned | 20.035 | 80.4% |
Have you experienced one or more of the following symptoms since the red warning? |
Number | Percentage |
|---|---|---|
| Elevated temperature or fever | 362 | 2.3% |
| Shortness of breath | 321 | 2.1% |
| Loss of smell / taste | 306 | 2.0% |
| Cough | 714 | 4.6% |
| Cold | 975 | 6.3% |
| Sore throat | 819 | 5.3% |
| Headache and limb pain | 891 | 5.7% |
| General weakness and fatigue | 941 | 6.1% |
| Diarrhea | 352 | 2.3% |
| No, none of the symptoms mentioned | 13.404 | 86.3% |
| When did the symptoms first appear? | Number | Percentage | Percentage (valid) |
|---|---|---|---|
| In the past 3 days | 547 | 2.1% | 25.9% |
| More than 3 days ago | 1.421 | 5.4% | 67.2% |
| Don´t know | 146 | 0.6% | 6.9% |
| -not specified- | 23.980 | 91.9% |
6 What can we learn from the event-driven user survey (EDUS)?
The EDUS is important for gaining basic information about CWA users and how they use the app. Thanks to the data provided by users on demographics (sex, age and level of education) and geographical indications, the study population could be compared with the total population and this provided information about geographical distribution and differences between urban and rural areas. Furthermore, by examining the contact behaviour of respondents who tested positive, conclusions could be drawn about the associations between infections in their social and working environment and among people they do not know. In addition, it was also possible to examine the relationship between self-assessed risk, intended behavioural changes and testing intention. Another important point was being able to analyse whether the respondents were surprised to receive a "red warning". The survey examined the reasons why users were surprised to receive the warning, as well as associations between level of surprise and testing, contact with a health-care provider, and actual infection. The analysis of users’ testing intentions provided information about test type, implementation and results. A more detailed investigation of the distribution of test results illustrated the speediness of the reporting chain, and users’ willingness to share their positive test results. One issue that will gain importance in the future is the symptoms of users who have tested positive. The long-term effects of SARS-CoV-2 (Long COVID), in particular, have come under focus in recent months and it is important that this issue is further investigated. In summary, users who shared positive test results via the CWA enabled other people to be warned promptly about the fact that they had been exposed to an increased risk of infection. Many of these users would not have known about their increased risk without the app. The CWA thus fulfils its purpose as an early warning tool, contributes to ending chains of infection, and, therefore, is an important tool for combating the pandemic. We would like to take this opportunity to thank all users who voluntarily participated in the EDUS and thus made an important contribution to research.
7 What to expect in the future?
In the coming weeks, this science blog will focus on data donation
for the CWA. We intend to analyse the extent to which the voluntary, data protection-compliant provision of user data enables information to be gained about user behaviour. We also plan to demonstrate how data donation has helped further develop the CWA.